- You are here:
-
Home

-
Contents (2)
-
Part XVII. Services and Trade
-
Transport Industry and Warehousing
-
Storage
- Gupta, V.P.

Gupta, V.P.
Case Study: Occupational health and Safety Campaigns at the National Level in India
Background
This case study, which presents an example of a successful national safety campaign, is based on 24 years of experience organizing the annual National Safety Day (NSD) Campaign in India. The Campaign celebrates the foundation by the Government of India of the National Safety Council (NSC) in the Ministry of Labour on 4 March 1966 as an autonomous, non-political and non-profit-making organization at the national level to generate, develop and sustain a voluntary movement with respect to occupational safety and health (OSH). The NSC’s Board of Governors is broad-based, with representation from all the central organizations of employers and trade unions. Total membership was approximately 4,000 in April 1995, drawn predominantly from the industrial sector, although there also is some membership from non-industrial sectors. In 1966, industrial workplaces in India experienced a rising trend of accidents, and enforcement of safety and health statutes by government agencies alone was not sufficient to reverse this trend. The birth of the NSC as a voluntary body in such a national perspective therefore constituted an important milestone. For many years, the NSC mainly concerned itself with industrial safety; however, with the coverage of some non-industrial sectors in recent years, its scope has been expanded from industrial to occupational safety. The coverage of occupational health, however, is still in its infancy in India. As the idea found favour of commemorating the foundation day of the NSC in the form of a national awareness campaign, the first NSD Campaign was launched in 1972. NSD became an annual event, and even though the duration of the Campaign has been increased to a week, it continues to be known as the National Safety Day Campaign due to the popularity that the title has gained.
Objectives
The objectives of the NSD Campaign, which have been kept broad, general and flexible, include the following:
- to increase OSH standards throughout India
- to enlist the support and participation of all major participants in different sectors at different levels, such as the central and state governments and their regulatory agencies and institutions; district and local administrations; non-governmental organizations (NGOs); employers’ organizations; public, private and joint-sector undertakings; trade unions
- to promote the active participation of employers in the education of their employees to achieve OSH goals in their workplace through the use of local knowledge, experience and talent
- to foster development of need-based programmes and activities, self-compliance with statutory requirements, and strengthening of professional OSH management systems in undertakings
- to bring into the fold of the voluntary OSH movement certain sectors not so far covered by safety and health legislation in the country—for instance, the construction sector, the research and development sector, and small shops and establishments using hazardous machines, equipment and materials.
The above objectives are part of an overall goal of creating and strengthening OSH culture in workplaces and integrating it with the work culture. In a developing country, achievement of this goal continues to be a highly challenging task.
Methodology and Approach
The methodology and approach used to introduce and promote the Campaign initially comprised two elements: (1) issuing of letters of appeal to NSC member organizations to organize the Campaign; and (2) providing them with professionally designed promotional materials such as badges, copies of the NSD pledge (see box), cloth banners, posters, stickers and so on, and promotional-cum-utility items such as key chains, ball-point pens, and paperweights with OSH messages printed on them. These materials are centrally designed, produced and distributed by the NSC with the following three aims.
- to make it convenient for the participants to organize the Campaign without having to go through the time-consuming and costly process of designing and producing such materials in small quantities themselves
- to ensure that the Campaign materials are of professional quality with appealing messages reflecting national OSH issues
- to generate income to contribute to NSC’s financial self-reliance with respect to the fulfilment of the wider objective of strengthening the voluntary OSH movement in India.
Text of National Safety Day Pledge
On this day, I solemnly affirm that I will rededicate myself to the cause of safety, health and protection of environment and will do my best to observe rules, regulations and procedures and develop attitudes and habits conducive for achieving these objectives.
I fully realize that accidents and diseases are a drain on the national economy and may lead to disablement, death, damage to health and property, social suffering and general degradation of environment.
I will do everything possible for prevention of accidents and occupational diseases and protection of environment in the interest of self, my family, community and the nation at large.
(In some states, the above pledge has been administered by the Governor of State to state ministers, other government officials, executives and workers from industries, and the public participating in NSD functions. In private enterprise, it is usual for the chief executive or some other top executive to administer the pledge to all employees.)
In its initial years, the Campaign was confined to NSC members and grew gradually. After about a decade, the methodology and approach were widened in the following strategic ways:
- The Union Ministry of Labour, responsible for OSH in the workplace, was asked to extend support to the NSC’s efforts to approach the State Governments for aid in the organization of celebrations. Since then, the Union Labour Minister has requested that the State Labour Ministers organize celebrations by constituting Campaign Committees at the state and district levels; these committees would be comprised of representatives of industries, workers and officials of the concerned government departments, and would send reports to the Central Government. Such support has given the Campaign national stature.
- The electronic media (television and radio) under state control has been advised by the Government to cover the Campaign. Such coverage has made the Campaign highly visible.
- The NSC’s own journals, as well as newspapers and magazines published by employers and trade unions and the national and local press, have been involved more effectively.
- The duration of the Campaign has been increased to a week, and flexibility has been provided to participants to start or conclude the Campaign on any convenient date, taking care to include 4 March (NSC foundation day) in the week. This has increased the span of visible impact of the Campaign.
- The state chapters and district action centres of the NSC have actively involved the state governments and district administrations in the Campaign at the grass roots.
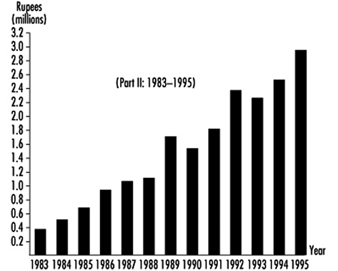
- The Campaign has grown over the years. Figure 1, figure 2 and figure 3 show this growth in terms of the persons reached for the pinning of the badge and the financial receipts from the sale of Campaign materials.
Figure 1. Growth of NSD campaign in terms of persons reached for pinning badge
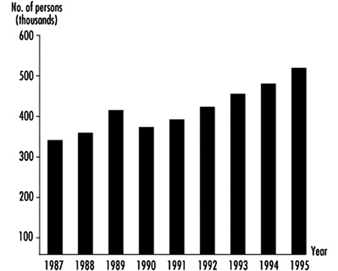
Figure 2. Growth in terms of financial receipts from sale of NSD campaign materials (1972-1982)
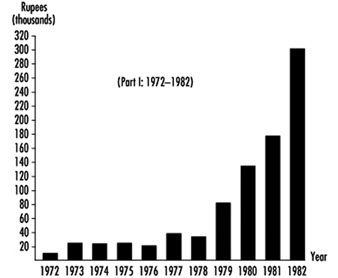
Figure 3. Growth in terms of financial receipts from sale of NSD campaign materials (1983-1995)
Participation at Different Levels
Participation by all stakeholders at the national, state, district and individual enterprise levels has been of vital importance to the success and effectiveness of the Campaign. However, the degree of involvement by various stakeholders has not been uniform. In the first instance, different stakeholders started participating in the Campaign in different years. Furthermore, their perceptions regarding their roles and needs vary greatly. For example, some governments, particularly those of industrialized states, have been organizing elaborate and purposeful activities, but in some other less industrialized states, they have been low-key. Similarly, while some industry associations have lent great support to the Campaign, others have yet to start participating. While activities at the national, state and district levels have dealt with broad issues, those at the individual enterprise/undertaking level have been more detailed and need-based.
Campaign Materials
The national OSH issues and messages to be projected through a particular year’s campaign materials produced by the NSC are identified by a core group of professionals from the NSC, industry and trade unions. The visuals for communicating them in a simple, humorous and effective way are designed by eminent cartoonists. In this way it is ensured that the campaign materials are original, attractive, appealing and rooted in Indian culture.
These materials fall into two broad categories: (1) purely promotional materials used for display and educational purposes; and (2) promotional-cum-utility materials which, besides promoting the OSH messages, are also good for day-to-day use. In the second category, most items are for the daily use of workers and are relatively inexpensive and affordable by managements of various enterprises for free distribution to all their employees. Some items appropriate for use of executives are also produced to give them a sense of involvement. To prevent the items from becoming monotonous, they are changed either completely or in style and appearance in different years.
As the Campaign has grown over the years and the demand for Campaign materials substantially increased, a number of private producers and suppliers have emerged who produce materials as per their own market research. This has been a welcome development. Individual enterprises also produce materials relevant to specific themes of their need-based campaigns. Many of these organize contests among their employees to generate ideas and then publicize the prize winners through their campaign materials.
Activities
At the national level, activities have taken the form of public functions, seminars, discussions and debates, the issuance of appeals and messages and the release of special films on national OSH issues. Participation of the Union Minister and top officials of the Ministry of Labour, Chairman and senior officials of NSC, senior executives from industry, national trade union leaders and eminent persons from institutions, NGOs and the public has imparted to these activities the desired level of impact. The national television and radio networks, the press and other print media have been involved in propagating these activities widely.
At the state level, activities vary from state to state but are generally of the same type as at the national level. The emphasis of these activities is on the projection of specific state issues through the medium of regional language. A welcome trend observed in state activities in recent years has been that an important government function, namely, distribution of state safety awards, is combined with the Campaign celebrations.
The activities at the individual enterprise level are more practical and varied. Generally, such activities are designed by the safety committee (if existing as per statutory requirements applicable to enterprises employing a certain minimum number of employees) or by a specially constituted task force set up by management. Some typical activities are contests among employees or among different departments for good housekeeping, lowest accident frequency rate, and accident-free work, safety posters, safety slogans, safety suggestions and so on, exhibitions, skits, dramas, one-act plays, songs, training programmes and seminars, lectures, screening of films, practical demonstrations, organizing of emergency drills, holding of functions, and so on. Experts from outside the enterprise are also invited as guest speakers.
Some of the most common and important approaches which have contributed to the effectiveness of activities at the enterprise level may be summarized as follows:
- The dramatizations and plays staged by employees of some enterprises have been of good professional quality and offer effective entertainment, communicating accident case histories with lessons to be learnt. Such plays have been video recorded for telecasting on state and national television networks, thereby increasing their impact.
- Qwaali, a popular form of song on the Indian subcontinent, has also been commonly used for communicating OSH messages while providing entertainment consistent with Indian cultural traditions.
- A number of large companies, in both the public and private sectors, have their own residential colonies and schools for the benefit of their employees. Many of these companies have designed activities including contests to involve families and students in safety and health; this has had a positive impact on the motivation of the employees. Even undertakings not having their own residential colony or school have used this approach to involve the families and school-age children of their employees with similar success.
- In the wake of the Bhopal disaster, many enterprises engaged in manufacture, storage or use of hazardous chemicals and having potential for major accidents have developed activities to create awareness of OSH in nearby communities. They invite members of these communities to visit their plants for exhibitions or functions during the Campaign. They also invite government authorities as guests of honour. This approach has been useful in building cooperation among industry, government and community, so important to ensure quick and effective response to chemical emergencies at the local level.
- Activities involving practical demonstrations of important safety-oriented resources such as the use of firefighting methods and personal protective equipment, the holding of emergency drills and the conducting of tailor-made in-plant training courses and seminars on specific needs have proved successful in creating enthusiasm and a supportive environment within enterprises.
The approaches listed are particularly suitable for OSH campaigns at the unit level.
Impact Achieved
The NSD Campaign has shown a positive impact on the trend of industrial injuries (reportable under the Factories Act) in India. As shown in table 1, the incidence rate of industrial injuries (injuries per 1,000 workers) decreased from 75.67 in 1971 to 26.54 in 1992 (the latest year for which published statistics are available), a reduction of about 65%. It should be noted that this reduction is due to the combined impact on OSH of government policy and legislation, enforcement, education and training, promotion, modernization of industrial processes and operations, and so on, as well as of NSD Campaign activities.
Table 1. Number of Indian working factories, estimated average daily employment, reportable injuries and their incidence rates
|
Year |
No. of working factories |
Estimated average daily |
Industrial injuries |
Rate of injuries per thousand employees in factories submitting returns |
||
|
Fatal |
Total |
Fatal |
Total |
|||
|
1971 |
81,078 |
5,085 |
635 |
325,180 |
0.15 |
75.67 |
|
1972 |
86,297 |
5,349 |
655 |
285,912 |
0.15 |
63.63 |
|
1973 |
91,055 |
5,500 |
666 |
286,010 |
0.15 |
62.58 |
|
1974 |
97,065 |
5,670 |
650 |
249,110 |
0.14 |
53.77 |
|
1975 |
104,374 |
5,771 |
660 |
242,352 |
0.14 |
50.86 |
|
1976 |
113,216 |
6,127 |
831 |
300,319 |
0.17 |
61.54 |
|
1977 |
119,715 |
6,311 |
690 |
316,273 |
0.14 |
63.95 |
|
1978 |
126,241 |
6,540 |
792 |
332,195 |
0.15 |
68.62 |
|
1979 |
135,173 |
6,802 |
829 |
318,380 |
0.16 |
62.19 |
|
1980 |
141,317 |
7,017 |
657 |
316,532 |
0.14 |
66.92 |
|
1981 |
149,285 |
7,240 |
687 |
333,572 |
0.16 |
76.73 |
|
1982(P) |
157,598 |
7,388 |
549 |
296,027 |
0.13 |
69.10 |
|
1983(P) |
163,040 |
7,444 |
456 |
213,160 |
0.13 |
55.63 |
|
1984(P)* |
167,541 |
7,603 |
824 |
302,726 |
0.10 |
36.72 |
|
1985(P)* |
175,316 |
7,691 |
807 |
279,126 |
0.23 |
58.70 |
|
1986(P) |
178,749 |
7,795 |
924 |
276,416 |
0.14 |
49.31 |
|
1987(P) |
183,586 |
7,835 |
895 |
236,596 |
0.14 |
41.54 |
|
1988(P) |
188,136 |
8,153 |
694 |
200,258 |
0.15 |
41.68 |
|
1989(P) |
193,258 |
8,330 |
706 |
162,037 |
0.16 |
35.11 |
|
1990(P) |
199,826 |
8,431 |
663 |
128,117 |
0.21 |
33.11 |
|
1991(P)* |
207,980 |
8,547 |
486 |
60,599 |
0.21 |
26.20 |
|
1992(P)* |
207,156 |
8,618 |
573 |
74,195 |
0.20 |
26.54 |
Key to Symbols: P = provisional; * = incomplete data.
Source: Labour Bureau.
The research and development sector under the Central Government, comprising 40 national laboratories located all over India and employing over 26,000 employees, including over 9,000 scientists, does not fall under the purview of any OSH legislation. For the last 3 years, the corporate level and the individual laboratories have started organizing NSD celebrations, have set up safety cells and are proceeding in a systematic way towards establishing a sound system of OSH management. This is a concrete example of the impact of the NSD Campaign in strengthening the voluntary OSH movement in India.
The organizations in charge of nuclear power stations, heavy water plants and research reactors, as well as other divisions in the Department of Atomic Energy (DAE) of the Government, have been organizing celebrations during the NSD Campaign. They have instituted interdepartmental contests and awards for achievements in the fields of safety, health and environmental protection. The enforcement of safety and health statutes in the above establishments is carried out by an independent agency under the control of DAE, but these units are not open to inspection by state regulating agencies covering other workplaces. Activities under the Campaign have served to create interaction between departmental and external regulatory agencies and between the NSC and other institutions, and have furthermore facilitated the dissemination of OSH information to the public.
Located on the west coast, Gujarat is one of the most industrialized states in India. The state has 525 medium and large factories manufacturing, storing or using one or more of 38 hazardous chemicals. All these factories have prepared and rehearsed emergency plans. As a part of the last NSD Campaign, each of these larger entities was requested by the Chief Inspector of Factories to impart practical training in the use of breathing apparatus and fire extinguishers to emergency-response workers from 10 small factories located in its neighbourhood. Six workers (two from each shift) were selected from each small unit, for a total of 31,500 workers from 5,250 units. This case is illustrative of the impact of the Campaign in making available practical emergency training to small units engaged in hazardous processes.
In conclusion, the most important contribution of the NSD Campaign may be summed up as creating awareness in business and industrial circles and the public that safety, health and environmental protection constitute a vital and integral part of the strategy for sustainable development. However, there is a long way to go before this strategy is translated into a greater reality. The NSD Campaign will no doubt have an increasing role to play in achieving this reality.
" DISCLAIMER: The ILO does not take responsibility for content presented on this web portal that is presented in any language other than English, which is the language used for the initial production and peer-review of original content. Certain statistics have not been updated since the production of the 4th edition of the Encyclopaedia (1998)."