Person–environment fit (PE) theory offers a framework for assessing and predicting how characteristics of the employee and the work environment jointly determine worker well-being and, in the light of this knowledge, how a model for identifying points of preventive intervention may be elaborated. Several PE fit formulations have been proposed, the most widely known ones being those of Dawis and Lofquist (1984); French, Rodgers and Cobb (1974); Levi (1972); McGrath (1976); and Pervin (1967). The theory of French and colleagues, illustrated in figure 1, may be used to discuss the conceptual components of PE fit theory and their implications for research and application.
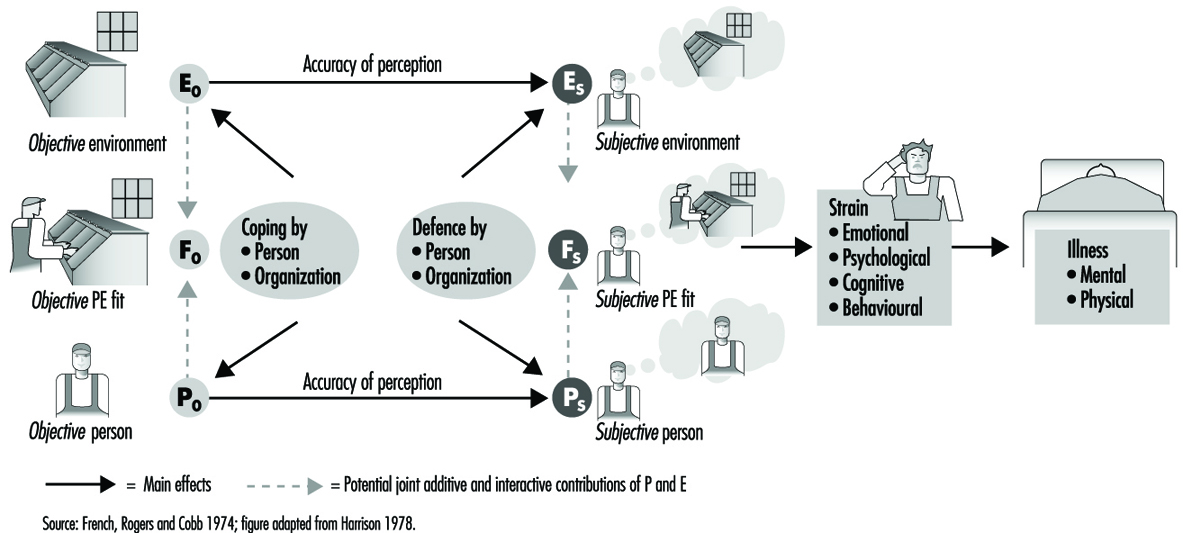
Figure 1. Schematic of French, Rogers and Cobb's theory of person-environment (PE) fit
Poor PE fit can be viewed from the perspectives of the employee’s needs (needs–supplies fit) as well as the job–environment’s demands (demands–abilities fit). The term needs–supplies fit refers to the degree to which employee needs, such as the need to use skills and abilities, are met by the work environment’s supplies and opportunities to satisfy those needs. Demands–abilities fit refers to the degree to which the job’s demands are met by the employee’s skills and abilities. These two types of fit can overlap. For example, work overload may leave the employer’s demands unmet as well as threaten the employee’s need to satisfy others.
Conceptualizing Person (P) and Environment (E)
Characteristics of the person (P) include needs as well as abilities. Characteristics of the environment (E) include supplies and opportunities for meeting the employee’s needs as well as demands which are made on the employee’s abilities. In order to assess the degree to which P equals (or fits), exceeds, or is less than E, the theory requires that P and E be measured along commensurate dimensions. Ideally, P and E should be measured on equal interval scales with true zero points. For example, one could assess PE fit on workload for a data-entry operator in terms of both the number of data-entry keystrokes per minute demanded by the job (E) and the employee’s keystroke speed (P). As a less ideal alternative, investigators often use Likert type scales. For example, one could assess how much the employee wants to control the work pace (P) and how much control is provided by the job’s technology (E) by using a rating scale, where a value of 1 corresponds to no control, or almost no control and a value of 5 corresponds to complete control.
Distinguishing Subjective from Objective Fit
Subjective fit (FS) refers to the employee’s perceptions of P and E, whereas objective fit (FO) refers to assessments that are, in theory, free of subjective bias and error. In practice, there is always measurement error, so that it is impossible to construct truly objective measures. Consequently, many researchers prefer to create a working distinction between subjective and objective fit, referring to measures of objective fit as ones which are relatively, rather than absolutely, immune to sources of bias and error. For example, one can assess objective PE fit on keystroke ability by examining the fit between a count of required keystrokes per minute in the actual workload assigned to the employee (EO) and the employee’s ability as assessed on an objective-type test of keystroke ability (PO). Subjective PE fit might be assessed by asking the employee to estimate per minute keystroke ability (PS) and the number of keystrokes per minute demanded by the job (ES).
Given the challenges of objective measurement, most tests of PE fit theory have used only subjective measures of P and E (for an exception, see Chatman 1991). These measures have tapped a variety of dimensions including fit on responsibility for the work and well-being of other persons, job complexity, quantitative workload and role ambiguity.
Dynamic Properties of the PE Fit Model
Figure 1 depicts objective fit influencing subjective fit which, in turn, has direct effects on well-being. Well-being is broken down into responses called strains, which serve as risk factors for subsequent illness. These strains can involve emotional (e.g., depression, anxiety), physiological (e.g., serum cholesterol, blood pressure), cognitive (e.g., low self-evaluation, attributions of blame to self or others), as well as behavioural responses (e.g., aggression, changes in lifestyle, drug and alcohol use).
According to the model, levels of and changes in objective fit, whether due to planned intervention or otherwise, are not always perceived accurately by the employee, so that discrepancies arise between objective and subjective fit. Thus, employees can perceive good fit as well as poor fit when, objectively, such is not the case.
Inaccurate employee perceptions can arise from two sources. One source is the organization, which, unintentionally or by design (Schlenker 1980), may provide the employee with inadequate information regarding the environment and the employee. The other source is the employee. The employee might fail to access available information or might defensively distort objective information about what the job requires or about his or her abilities and needs — Taylor (1991) cites such an example.
French, Rodgers and Cobb (1974) use the concept of defences to refer to employee processes for distorting the components of subjective fit, PS and ES, without changing the commensurate components of objective fit, PO and EO. By extension, the organization can also engage in defensive processes—for example, cover-ups, denial or exaggeration—aimed at modifying employee perceptions of subjective fit without concomitantly modifying objective fit.
The concept of coping is, by contrast, reserved for responses and processes that aim to alter and, in particular, improve objective fit. The employee can attempt to cope by improving objective skills (PO) or by changing objective job demands and resources (EO) such as through a change of jobs or assigned responsibilities. By extension, the organization can also apply coping strategies to improve objective PE fit. For example, organizations can make changes in selection and promotion strategies, in training and in job design to alter EO and PO.
The distinctions between coping and defence on the one hand and objective and subjective fit on the other can lead to an array of practical and scientific questions regarding the consequences of using coping and defence and the methods for distinguishing between effects of coping and effects of defence on PE fit. By derivation from the theory, sound answers to such questions require sound measures of objective as well as subjective PE fit.
Statistical Models
PE fit can have non-linear relations with psychological strain. Figure 2 presents a U-shaped curve as an illustration. The lowest level of psychological strain on the curve occurs when employee and job characteristics fit each other (P = E). Strain increases as the employee’s abilities or needs respectively fall short of the job’s demands or resources (P
Figure 2. Hypothetical U-shaped relation of person-environment fit to psychological strain

Efficacy of the Model
A variety of different approaches to the measurement of PE fit demonstrate the model’s potential for predicting well-being and performance. For example, careful statistical modelling found that PE fit explained about 6% more variance in job satisfaction than was explained by measures of P or E alone (Edwards and Harrison 1993). In a series of seven studies of accountants measuring PE fit using a card-sort method, high-performers had higher correlations between P and E (average r = 0.47) than low performers (average r = 0.26; Caldwell and O’Reilly 1990). P was assessed as the employee’s knowledge, skills and abilities (KSAs), and E was assessed as the commensurate KSAs required by the job. Poor PE fit between the accountant’s values and the firm’s also served to predict employee turnover (Chatman 1991).