- You are here:
-
Home

-
Part VIII. Accidents and Safety Management
- Safety Policy and Leadership

59. Safety Policy and Leadership
Chapter Editor: Jorma Saari
Table of Contents
Tables and Figures
Safety Policy, Leadership and Culture
Dan Petersen
Safety Culture and Management
Marcel Simard
Organizational Climate and Safety
Nicole Dedobbeleer and François Béland
Participatory Workplace Improvement Process
Jorma Saari
Methods of Safety Decision Making
Terje Sten
Risk Perception
Bernhard Zimolong and Rüdiger Trimpop
Risk Acceptance
Rüdiger Trimpop and Bernhard Zimolong
Tables
Click a link below to view table in article context.
1. Safety climate measures
2. Tuttava & other programme/techniques differences
3. An example of best work practices
4. Performance targets at a printing ink factory
Figures
Point to a thumbnail to see figure caption, click to see figure in article context.


Safety Policy, Leadership and Culture
The subjects of leadership and culture are the two most important considerations among the conditions necessary to achieve excellence in safety. Safety policy may or may not be regarded as being important, depending upon the worker’s perception as to whether management commitment to and support of the policy is in fact carried out every day. Management often writes the safety policy and then fails to ensure that it is enforced by managers and supervisors on the job, every day.
Safety Culture and Safety Results
We used to believe that there were certain “essential elements” of a “safety programme”. In the United States, regulatory agencies provide guidelines as to what those elements are (policy, procedures, training, inspections, investigations, etc.). Some provinces in Canada state that there are 20 essential elements, while some organizations in the United Kingdom suggest that 30 essential elements should be considered in safety programmes. Upon close examination of the rationale behind the different lists of essential elements, it becomes obvious that the lists of each reflect merely the opinion of some writer from the past (Heinrich, say, or Bird). Similarly, regulations on safety programming often reflect the opinion of some early writer. There is seldom any research behind these opinions, resulting in situations where the essential elements may work in one organization and not in another. When we do actually look at the research on safety system effectiveness, we begin to understand that although there are many essential elements which are applicable to safety results, it is the worker’s perception of the culture that determines whether or not any single element will be effective. There are a number of studies cited in the references which lead to the conclusion that there are no “must haves” and no “essential” elements in a safety system.
This poses some serious problems since safety regulations tend to instruct organizations simply to “have a safety programme” that consists of five, seven, or any number of elements, when it is obvious that many of the prescribed activities will not work and will waste time, effort and resources which could be used to undertake the pro-active activities that will prevent loss. It is not which elements are used that determines the safety results; rather it is the culture in which these elements are used that determines success. In a positive safety culture, almost any elements will work; in a negative culture, probably none of the elements will get results.
Building Culture
If the culture of the organization is so important, efforts in safety management ought to be aimed first and foremost at building culture in order that those safety activities which are instituted will get results. Culture can be loosely defined as “the way it is around here”. Safety culture is positive when the workers honestly believe that safety is a key value of the organization and can perceive that it is high on the list of organization priorities. This perception by the workforce can be attained only when they see management as credible; when the words of safety policy are lived on a daily basis; when management’s decisions on financial expenditures show that money is spent for people (as well as to make more money); when the measures and rewards provided by management force mid-manager and supervisory performance to satisfactory levels; when workers have a role in problem solving and decision making; when there is a high degree of confidence and trust between management and the workers; when there is openness of communications; and when workers receive positive recognition for their work.
In a positive safety culture like that described above, almost any element of the safety system will be effective. In fact, with the right culture, an organization hardly even needs a “safety programme”, for safety is dealt with as a normal part of the management process. To achieve a positive safety culture, certain criteria must be met
1. A system must be in place that ensures regular daily pro-active supervisory (or team) activities.
2. The system must actively ensure that middle-management tasks and activities are carried out in these areas:
- ensuring subordinate (supervisory or team) regular performance
- ensuring the quality of that performance
- engaging in certain well-defined activities to show that safety is so important that even upper managers are doing something about it.
3. Top management must visibly demonstrate and support that safety has a high priority in the organization.
4. Any worker who chooses to should be able to be actively engaged in meaningful safety-related activities.
5. The safety system must be flexible, allowing choices to be made at all levels.
6. The safety effort must be seen as positive by the workforce.
These six criteria can be met regardless of the style of management of the organization, whether authoritarian or participative, and with completely different approaches to safety.
Culture and Safety Policy
Having a policy on safety seldom achieves anything unless it is followed up with systems that make the policy live. For example, if the policy states that supervisors are responsible for safety, it means nothing unless the following is in place:
- Management has a system where there is a clear definition of role and of what activities must be carried out to satisfy the safety responsibility.
- The supervisors know how to fulfil that role, are supported by management, believe the tasks are achievable and carry out their tasks as a result of proper planning and training.
- They are regularly measured to ensure they have completed the defined tasks (but not measured by an accident record) and to obtain feedback to determine whether or not tasks should be changed.
- There is a reward contingent upon task completion in the performance appraisal system or in whatever is the driving mechanism of the organization.
These criteria are true at each level of the organization; tasks must be defined, there must be a valid measure of performance (task completion) and a reward contingent upon performance. Thus, safety policy does not drive performance of safety; accountability does. Accountability is the key to building culture. It is only when the workers see supervisors and management fulfilling their safety tasks on a daily basis that they believe that management is credible and that top management really meant it when they signed the safety policy documents.
Leadership and Safety
It is obvious from the above that leadership is crucial to safety results, as leadership forms the culture that determines what will and will not work in the organization’s safety efforts. A good leader makes it clear what is wanted in terms of results, and also makes it clear exactly what will be done in the organization to achieve the results. Leadership is infinitely more important than policy, for leaders, through their actions and decisions, send clear messages throughout the organization as to which policies are important and which are not. Organizations sometimes state via policy that health and safety are key values, and then construct measures and reward structures that promote the opposite.
Leadership, through its actions, systems, measures and rewards, clearly determines whether or not safety will be achieved in the organization. This has never been more apparent to every worker in industry than during the 1990s. There has never been more stated allegiance to health and safety than in the last ten years. At the same time, there has never been more down-sizing or “right-sizing” and more pressure for production increases and cost reduction, creating more stress, more forced overtime, more work for fewer workers, more fear for the future and less job security than ever before. Right-sizing has decimated middle managers and supervisors and put more work on fewer workers (the key persons in safety). There is a general perception of overload at all levels of the organization. Overload causes more accidents, more physical fatigue, more psychological fatigue, more stress claims, more repetitive motion conditions and more cumulative trauma disorder. There has also been deterioration in many organizations of the relationship between the company and the worker, where there used to be mutual feelings of trust and security. In the former environment, a worker may have continued to “work hurt”. However, when workers fear for their jobs and they see that management ranks are so thin, they are non-supervised, they begin to feel as though the organization does not care for them any more, with the resultant deterioration in safety culture.
Gap Analysis
Many organizations are going through a simple process known as gap analysis consisting of three steps: (1) determining where you want to be; (2) determining where you are now and (3) determining how to get from where you are to where you want to be, or how to “bridge the gap”.
Determining where you want to be. What do you want your organization’s safety system to look like? Six criteria have been suggested against which to assess an organization’s safety system. If these are rejected, you must measure your organization’s safety system against some other criteria. For example, you might want to look at the seven climate variables of organizational effectiveness as established by Dr. Rensis Likert (1967), who showed that the better an organization is in certain things, the more likely it will be successful in economic success, and thus in safety. These climate variables are as follows:
- increasing the amount of worker confidence and managers’ general interest in the understanding of safety problems
- giving training and help where and as needed
- offering needed teaching as to how to solve problems
- providing the available required trust, enabling information sharing between management and their subordinates
- soliciting the ideas and opinions of the worker
- providing for approachability of top management
- recognizing the worker for doing a good job rather than for merely giving answers.
There are other criteria against which to assess oneself such as the criterion established to determine the likelihood of catastrophic events suggested by Zembroski (1991).
Determining where you are now. This is perhaps the most difficult. It was originally thought that safety system effectiveness could be determined by measuring the number of injuries or some subset of injuries (recordable injuries, lost time injuries, frequency rates, etc.). Due to the low numbers of these data, they usually have little or no statistical validity. Recognizing this in the 1950s and 1960s, investigators tended away from incident measures and attempted to judge safety system effectiveness through audits. The attempt was made to predetermine what must be done in an organization to get results, and then to determine by measurement whether or not those things were done.
For years it was assumed that audit scores predicted safety results; the better the audit score this year, the lower the accident record next year. We now know (from a variety of research) that audit scores do not correlate very well (if at all) with the safety record. The research suggests that most audits (external and sometimes internally constructed) tend to correlate much better with regulatory compliance than they do with the safety record. This is documented in a number of studies and publications.
A number of studies correlating audit scores and the injury record in large companies over periods of time (seeking to determine whether the injury record does have statistical validity) have found a zero correlation, and in some cases a negative correlation, between audit results and the injury record. Audits in these studies do tend to correlate positively with regulatory compliance.
Bridging the Gap
There appear to be only a few measures of safety performance that are valid (that is, they truly correlate with the actual accident record in large companies over long periods of time) which can be used to “bridge the gap”:
- behaviour sampling
- in-depth worker interviews
- perception surveys.
Perhaps the most important measure to look at is the perception survey, which is used to assess the current status of any organization’s safety culture. Critical safety issues are identified and any differences in management and employee views on the effectiveness of company safety programmes are clearly demonstrated.
The survey begins with a short set of demographic questions which can be used to organize graphs and tables to show the results (see figure 1). Typically participants are asked about their employee level, their general work location, and perhaps their trade group. At no point are the employees asked questions which would enable them to be identified by the people who are scoring the results.
Figure 1. Example of perception survey results
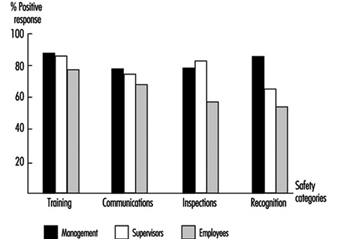
The second part of the survey consists of a number of questions. The questions are designed to uncover employee perceptions about various safety categories. Each question may affect the score of more than one category. A cumulative per cent positive response is computed for each category. The percentages for the categories are graphed (see figure 1) to display the results in descending order of positive perception by the line workers. Those categories on the right-hand side of the graph are the ones that are perceived by employees as being the least positive and are therefore the most in need of improvement.
Summary
Much has been learned about what determines the effectiveness of a safety system in recent years. It is recognized that culture is the key. The employees’ perception of the culture of the organization dictates their behaviour, and thus the culture determines whether or not any element of the safety programme will be effective.
Culture is established not by written policy, but rather by leadership; by day-to-day actions and decisions; and by the systems in place that ensure whether safety activities (performance) of managers, supervisors and work teams are carried out. Culture can be built positively through accountability systems that ensure performance and through systems that allow, encourage and get worker involvement. Moreover, culture can be validly assessed through perception surveys, and improved once the organization determines where it is they would like to be.
Safety Culture and Management
Safety culture is a new concept among safety professionals and academic researchers. Safety culture may be considered to include various other concepts referring to cultural aspects of occupational safety, such as safety attitudes and behaviours as well as a workplace’s safety climate, which are more commonly referred to and are fairly well documented.
A question arises whether safety culture is just a new word used to replace old notions, or does it bring new substantive content that may enlarge our understanding of the safety dynamics in organizations? The first section of this article answers this question by defining the concept of safety culture and exploring its potential dimensions.
Another question that may be raised about safety culture concerns its relationship to the safety performance of firms. It is accepted that similar firms classified in a given risk category frequently differ as to their actual safety performance. Is safety culture a factor of safety effectiveness, and, if so, what kind of safety culture will succeed in contributing to a desirable impact? This question is addressed in the second section of the article by reviewing some relevant empirical evidence concerning the impact of safety culture on safety performance.
The third section addresses the practical question of the management of the safety culture, in order to help managers and other organizational leaders to build a safety culture that contributes to the reduction of occupational accidents.
Safety Culture: Concept and Realities
The concept of safety culture is not yet very well defined, and refers to a wide range of phenomena. Some of these have already been partially documented, such as the attitudes and the behaviours of managers or workers towards risk and safety (Andriessen 1978; Cru and Dejours 1983; Dejours 1992; Dodier 1985; Eakin 1992; Eyssen, Eakin-Hoffman and Spengler 1980; Haas 1977). These studies are important for presenting evidence about the social and organizational nature of individuals’ safety attitudes and behaviours (Simard 1988). However, by focusing on particular organizational actors like managers or workers, they do not address the larger question of the safety culture concept, which characterizes organizations.
A trend of research which is closer to the comprehensive approach emphasized by the safety culture concept is represented by studies on the safety climate that developed in the 1980s. The safety climate concept refers to the perceptions workers have of their work environment, particularly the level of management’s safety concern and activities and their own involvement in the control of risks at work (Brown and Holmes 1986; Dedobbeleer and Béland 1991; Zohar 1980). Theoretically, it is believed that workers develop and use such sets of perceptions to ascertain what they believe is expected of them within the organizational environment, and behave accordingly. Though conceptualized as an individual attribute from a psychological perspective, the perceptions which form the safety climate give a valuable assessment of the common reaction of workers to an organizational attribute that is socially and culturally constructed, in this case by the management of occupational safety in the workplace. Consequently, although the safety climate does not completely capture the safety culture, it may be viewed as a source of information about the safety culture of a workplace.
Safety culture is a concept that (1) includes the values, beliefs and principles that serve as a foundation for the safety management system and (2) also includes the set of practices and behaviours that exemplify and reinforce those basic principles. These beliefs and practices are meanings produced by organizational members in their search for strategies addressing issues such as occupational hazards, accidents and safety at work. These meanings (beliefs and practices) are not only shared to a certain extent by members of the workplace but also act as a primary source of motivated and coordinated activity regarding the question of safety at work. It can be deduced that culture should be differentiated from both concrete occupational safety structures (the presence of a safety department, of a joint safety and health committee and so on) and existent occupational safety programmes (made up of hazards identification and control activities such as workplace inspections, accident investigation, job safety analysis and so on).
Petersen (1993) argues that safety culture “is at the heart of how safety systems elements or tools... are used” by giving the following example:
Two companies had a similar policy of investigating accidents and incidents as part of their safety programmes. Similar incidents occurred in both companies and investigations were launched. In the first company, the supervisor found that the workers involved behaved unsafely, immediately warned them of the safety infraction and updated their personal safety records. The senior manager in charge acknowledged this supervisor for enforcing workplace safety. In the second company, the supervisor considered the circumstances of the incident, namely that it occurred while the operator was under severe pressure to meet production deadlines after a period of mechanical maintenance problems that had slowed production, and in a context where the attention of employees was drawn from safety practices because recent company cutbacks had workers concerned about their job security. Company officials acknowledged the preventive maintenance problem and held a meeting with all employees where they discussed the current financial situation and asked workers to maintain safety while working together to improve production in view of helping the corporation’s viability.
“Why”, asked Petersen, “did one company blame the employee, fill out the incident investigation forms and get back to work while the other company found that it must deal with fault at all levels of the organization?” The difference lies in the safety cultures, not the safety programmes themselves, although the cultural way this programme is put into practice, and the values and beliefs that give meaning to actual practices, largely determine whether the programme has sufficient real content and impact.
From this example, it appears that senior management is a key actor whose principles and actions in occupational safety largely contribute to establish the corporate safety culture. In both cases, supervisors responded according to what they perceived to be “the right way of doing things”, a perception that had been reinforced by the consequent actions of top management. Obviously, in the first case, top management favoured a “by-the-book”, or a bureaucratic and hierarchical safety control approach, while in the second case, the approach was more comprehensive and conducive to managers’ commitment to, and workers’ involvement in, safety at work. Other cultural approaches are also possible. For example, Eakin (1992) has shown that in very small businesses, it is common that the top manager completely delegates responsibility for safety to the workers.
These examples raise the important question of the dynamics of a safety culture and the processes involved in the building, the maintenance and the change of organizational culture regarding safety at work. One of these processes is the leadership demonstrated by top managers and other organizational leaders, like union officers. The organizational culture approach has contributed to renewed studies of leadership in organizations by showing the importance of the personal role of both natural and organizational leaders in demonstrating commitment to values and creating shared meanings among organizational members (Nadler and Tushman 1990; Schein 1985). Petersen’s example of the first company illustrates a situation where top management’s leadership was strictly structural, a matter merely of establishing and reinforcing compliance to the safety programme and to rules. In the second company, top managers demonstrated a broader approach to leadership, combining a structural role in deciding to allow time to perform necessary preventive maintenance with a personal role in meeting with employees to discuss safety and production in a difficult financial situation. Finally, in Eakin’s study, senior managers of some small businesses seem to play no leadership role at all.
Other organizational actors who play a very important role in the cultural dynamics of occupational safety are middle managers and supervisors. In their study of more than one thousand first-line supervisors, Simard and Marchand (1994) show that a strong majority of supervisors are involved in occupational safety, though the cultural patterns of their involvement may differ. In some workplaces, the dominant pattern is what they call “hierarchical involvement” and is more control-oriented; in other organizations the pattern is “participatory involvement”, because supervisors both encourage and allow their employees to participate in accident-prevention activities; and in a small minority of organizations, supervisors withdraw and leave safety up to the workers. It is easy to see the correspondence between these styles of supervisory safety management and what has been previously said about the patterns of upper-level managers’ leadership in occupational safety. Empirically, though, the Simard and Marchand study shows that the correlation is not a perfect one, a circumstance that lends support to Petersen’s hypothesis that a major problem of many executives is how to build a strong, people-oriented safety culture among the middle and supervisory management. Part of this problem may be due to the fact that most of the lower-level managers are still predominantly production-minded and prone to blame workers for workplace accidents and other safety mishaps (DeJoy 1987 and 1994; Taylor 1981).
This emphasis on management should not be viewed as disregarding the importance of workers in the safety culture dynamics of workplaces. Workers’ motivation and behaviours regarding safety at work are influenced by the perceptions they have of the priority given to occupational safety by their supervisors and top managers (Andriessen 1978). This top-down pattern of influence has been proven in numerous behavioural experiments, using managers’ positive feedback to reinforce compliance to formal safety rules (McAfee and Winn 1989; Näsänen and Saari 1987). Workers also spontaneously form work groups when the organization of work offers appropriate conditions that allow them to get involved in the formal or informal safety management and regulation of the workplace (Cru and Dejours 1983; Dejours 1992; Dwyer 1992). This latter pattern of workers’ behaviours, more oriented towards the safety initiatives of work groups and their capacity for self-regulation, may be used positively by management to develop workforce involvement and safety in the building of a workplace’s safety culture.
Safety Culture and Safety Performance
There is a growing body of empirical evidence concerning the impact of safety culture on safety performance. Numerous studies have investigated characteristics of companies having low accident rates, while generally comparing them with similar companies having higher-than-average accident rates. A fairly consistent result of these studies, conducted in industrialized as well as in developing countries, emphasizes the importance of senior managers’ safety commitment and leadership for safety performance (Chew 1988; Hunt and Habeck 1993; Shannon et al. 1992; Smith et al. 1978). Moreover, most studies show that in companies with lower accident rates, the personal involvement of top managers in occupational safety is at least as important as their decisions in the structuring of the safety management system (functions that would include the use of financial and professional resources and the creation of policies and programmes, etc.). According to Smith et al. (1978) active involvement of senior managers acts as a motivator for all levels of management by keeping up their interest through participation, and for employees by demonstrating management’s commitment to their well-being. Results of many studies suggest that one of the best ways of demonstrating and promoting its humanistic values and people-oriented philosophy is for senior management to participate in highly visible activities, such as workplace safety inspections and meetings with employees.
Numerous studies regarding the relationship between safety culture and safety performance pinpoint the safety behaviours of first-line supervisors by showing that supervisors’ involvement in a participative approach to safety management is generally associated with lower accident rates (Chew 1988; Mattila, Hyttinen and Rantanen 1994; Simard and Marchand 1994; Smith et al. 1978). Such a pattern of supervisors’ behaviour is exemplified by frequent formal and informal interactions and communications with workers about work and safety, paying attention to monitoring workers’ safety performance and giving positive feedback, as well as developing the involvement of workers in accident-prevention activities. Moreover, the characteristics of effective safety supervision are the same as those for generally efficient supervision of operations and production, thereby supporting the hypothesis that there is a close connection between efficient safety management and good general management.
There is evidence that a safety-oriented workforce is a positive factor for the firm’s safety performance. However, perception and conception of workers’ safety behaviours should not be reduced to just carefulness and compliance with management safety rules, though numerous behavioural experiments have shown that a higher level of workers’ conformity to safety practices reduces accident rates (Saari 1990). Indeed, workforce empowerment and active involvement are also documented as factors of successful occupational safety programmes. At the workplace level, some studies offer evidence that effectively functioning joint health and safety committees (consisting of members who are well trained in occupational safety, cooperate in the pursuit of their mandate and are supported by their constituencies) significantly contribute to the firm’s safety performance (Chew 1988; Rees 1988; Tuohy and Simard 1992). Similarly, at the shop-floor level, work groups that are encouraged by management to develop team safety and self-regulation generally have a better safety performance than work groups subject to authoritarianism and social disintegration (Dwyer 1992; Lanier 1992).
It can be concluded from the above-mentioned scientific evidence that a particular type of safety culture is more conducive to safety performance. In brief, this safety culture combines top management’s leadership and support, lower management’s commitment and employees’ involvement in occupational safety. Actually, such a safety culture is one that scores high on what could be conceptualized as the two major dimensions of the safety culture concept, namely safety mission and safety involvement, as shown in figure 1.
Figure 1. Typology of safety cultures
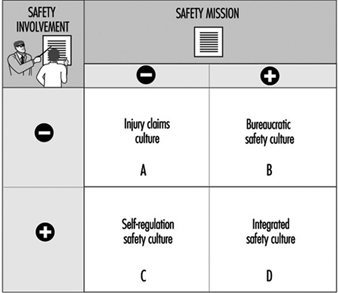
Safety mission refers to the priority given to occupational safety in the firm’s mission. Literature on organizational culture stresses the importance of an explicit and shared definition of a mission that grows out of and supports the key values of the organization (Denison 1990). Consequently, the safety mission dimension reflects the degree to which occupational safety and health are acknowledged by top management as a key value of the firm, and the degree to which upper-level managers use their leadership to promote the internalization of this value in management systems and practices. It can then be hypothesized that a strong sense of safety mission (+) impacts positively on safety performance because it motivates individual members of the workplace to adopt goal-directed behaviour regarding safety at work, and facilitates coordination by defining a common goal as well as an external criterion for orienting behaviour.
Safety involvement is where supervisors and employees join together to develop team safety at the shop-floor level. Literature on organizational culture supports the argument that high levels of involvement and participation contribute to performance because they create among organizational members a sense of ownership and responsibility leading to a greater voluntary commitment that facilitates the coordination of behaviour and reduces the necessity of explicit bureaucratic control systems (Denison 1990). Moreover, some studies show that involvement can be a managers’ strategy for effective performance as well as a workers’ strategy for a better work environment (Lawler 1986; Walton 1986).
According to figure 1, workplaces combining a high level of these two dimensions should be characterized by what we call an integrated safety culture, which means that occupational safety is integrated into the organizational culture as a key value, and into the behaviours of all organizational members, thereby reinforcing involvement from top managers down to the rank-and-file employees. The empirical evidence mentioned above supports the hypothesis that this type of safety culture should lead workplaces to the best safety performance when compared to other types of safety cultures.
The Management of an Integrated Safety Culture
Managing an integrated safety culture first requires the senior management’s will to build it into the organizational culture of the firm. This is no simple task. It goes far beyond adopting an official corporate policy emphasizing the key value and priority given to occupational safety and to the philosophy of its management, although indeed the integration of safety at work in the organization’s core values is a cornerstone in the building of an integrated safety culture. Indeed, top management should be conscious that such a policy is the starting point of a major organizational change process, since most organizations are not yet functioning according to an integrated safety culture. Of course, the details of the change strategy will vary depending on what the workplace’s existing safety culture already is (see cells A, B and C of figure 1). In any case, one of the key issues is for the top management to behave congruently with such a policy (in other words to practice what it preaches). This is part of the personal leadership top managers should demonstrate in implementing and enforcing such a policy. Another key issue is for senior management to facilitate the structuring or restructuring of various formal management systems so as to support the building of an integrated safety culture. For example, if the existing safety culture is a bureaucratic one, the role of the safety staff and joint health and safety committee should be reoriented in such a way as to support the development of supervisors’ and work teams’ safety involvement. In the same way, the performance evaluation system should be adapted so as to acknowledge lower-level managers’ accountability and the performance of work groups in occupational safety.
Lower-level managers, and particularly supervisors, also play a critical role in the management of an integrated safety culture. More specifically, they should be accountable for the safety performance of their work teams and they should encourage workers to get actively involved in occupational safety. According to Petersen (1993), most lower-level managers tend to be cynical about safety because they are confronted with the reality of upper management’s mixed messages as well as the promotion of various programmes that come and go with little lasting impact. Therefore, building an integrated safety culture often may require a change in the supervisors’ pattern of safety behaviour.
According to a recent study by Simard and Marchand (1995), a systematic approach to supervisors’ behaviour change is the most efficient strategy to effect change. Such an approach consists of coherent, active steps aimed at solving three major problems of the change process: (1) the resistance of individuals to change, (2) the adaptation of existing management formal systems so as to support the change process and (3) the shaping of the informal political and cultural dynamics of the organization. The latter two problems may be addressed by upper managers’ personal and structural leadership, as mentioned in the preceding paragraph. However, in unionized workplaces, this leadership should shape the organization’s political dynamics so as to create a consensus with union leaders regarding the development of participative safety management at the shop-floor level. As for the problem of supervisors’ resistance to change, it should not be managed by a command-and-control approach, but by a consultative approach which helps supervisors participate in the change process and develop a sense of ownership. Techniques such as the focus group and ad hoc committee, which allow supervisors and work teams to express their concerns about safety management and to engage in a problem-solving process, are frequently used, combined with appropriate training of supervisors in participative and effective supervisory management.
It is not easy to conceive a truly integrated safety culture in a workplace that has no joint health and safety committee or worker safety delegate. However, many industrialized and some developing countries now have laws and regulations that encourage or mandate workplaces to establish such committees and delegates. The risk is that these committees and delegates may become mere substitutes for real employee involvement and empowerment in occupational safety at the shop-floor level, thereby serving to reinforce a bureaucratic safety culture. In order to support the development of an integrated safety culture, joint committees and delegates should foster a decentralized and participative safety management approach, for example by (1) organizing activities that raise employees’ consciousness of workplace hazards and risk-taking behaviours, (2) designing procedures and training programmes that empower supervisors and work teams to solve many safety problems at the shop-floor level, (3) participating in the workplace’s safety performance appraisal and (4) giving reinforcing feedback to supervisors and workers.
Another powerful means of promoting an integrated safety culture among employees is to conduct a perception survey. Workers generally know where many of the safety problems are, but since no one asks them their opinion, they resist getting involved in the safety programme. An anonymous perception survey is a means to break this stalemate and promote employees’ safety involvement while providing senior management with feedback that can be used to improve the safety programme’s management. Such a survey can be done using an interview method combined with a questionnaire administered to all or to a statistically valid sample of employees (Bailey 1993; Petersen 1993). The survey follow-up is crucial for building an integrated safety culture. Once the data are available, top management should proceed with the change process by creating ad hoc work groups with participation from every echelon of the organization, including workers. This will provide for more in-depth diagnoses of problems identified in the survey and will recommend ways of improving aspects of the safety management that need it. Such a perception survey may be repeated every year or two, in order to periodically assess the improvement of their safety management system and culture.
Organizational Climate and Safety
We live in an era of new technology and more complex production systems, where fluctuations in global economics, customer requirements and trade agreements affect a work organization’s relationships (Moravec 1994). Industries are facing new challenges in the establishment and maintenance of a healthy and safe work environment. In several studies, management’s safety efforts, management’s commitment and involvement in safety as well as quality of management have been stressed as key elements of the safety system (Mattila, Hyttinen and Rantanen 1994; Dedobbeleer and Béland 1989; Smith 1989; Heinrich, Petersen and Roos 1980; Simonds and Shafai-Sahrai 1977; Komaki 1986; Smith et al. 1978).
According to Hansen (1993a), management’s commitment to safety is not enough if it is a passive state; only active, visible leadership which creates a climate for performance can successfully guide a corporation to a safe workplace. Rogers (1961) indicated that “if the administrator, or military or industrial leader, creates such a climate within the organization, then staff will become more self-responsive, more creative, better able to adapt to new problems, more basically cooperative.” Safety leadership is thus seen as fostering a climate where working safely is esteemed—a safety climate.
Very little research has been done on the safety climate concept (Zohar 1980; Brown and Holmes 1986; Dedobbeleer and Béland 1991; Oliver, Tomas and Melia 1993; Melia, Tomas and Oliver 1992). People in organizations encounter thousands of events, practices and procedures, and they perceive these events in related sets. What this implies is that work settings have numerous climates and that safety climate is seen as one of them. As the concept of climate is a complex and multilevel phenomenon, organizational climate research has been plagued by theoretical, conceptual and measurement problems. It thus seems crucial to examine these issues in safety climate research if safety climate is to remain a viable research topic and a worthwhile managerial tool.
Safety climate has been considered a meaningful concept which has considerable implications for understanding employee performance (Brown and Holmes 1986) and for assuring success in injury control (Matttila, Hyttinen and Rantanen 1994). If safety climate dimensions can be accurately assessed, management may use them to both recognize and evaluate potential problem areas. Moreover, research results obtained with a standardized safety climate score can yield useful comparisons across industries, independent of differences in technology and risk levels. A safety climate score may thus serve as a guideline in the establishment of a work organization’s safety policy. This article examines the safety climate concept in the context of the organizational climate literature, discusses the relationship between safety policy and safety climate and examines the implications of the safety climate concept for leadership in the development and enforcement of a safety policy in an industrial organization.
The Concept of Safety Climate in Organizational Climate Research
Organizational climate research
Organizational climate has been a popular concept for some time. Multiple reviews of organizational climate have appeared since the mid-1960s (Schneider 1975a; Jones and James 1979; Naylor, Pritchard and Ilgen 1980; Schneider and Reichers 1983; Glick 1985; Koys and DeCotiis 1991). There are several definitions of the concept. Organizational climate has been loosely used to refer to a broad class of organizational and perceptual variables that reflect individual-organizational interactions (Glick 1985; Field and Abelson 1982; Jones and James 1979). According to Schneider (1975a), it should refer to an area of research rather than a specific unit of analysis or a particular set of dimensions. The term organizational climate should be supplanted by the word climate to refer to a climate for something.
The study of climates in organizations has been difficult because it is a complex and multi-level phenomenon (Glick 1985; Koys and DeCotiis 1991). Nevertheless, progress has been made in conceptualizing the climate construct (Schneider and Reichers 1983; Koys and DeCotiis 1991). A distinction proposed by James and Jones (1974) between psychological climates and organizational climates has gained general acceptance. The differentiation is made in terms of level of analysis. The psychological climate is studied at the individual level of analysis, and the organizational climate is studied at the organizational level of analysis. When regarded as an individual attribute, the term psychological climate is recommended. When regarded as an organizational attribute, the term organizational climate is seen as appropriate. Both aspects of climate are considered to be multi-dimensional phenomena, descriptive of the nature of employees perceptions of their experiences within a work organization.
Although the distinction between psychological and organizational climate is generally accepted, it has not extricated organizational climate research from its conceptual and methodological problems (Glick 1985). One of the unresolved problems is the aggregation problem. Organizational climate is often defined as a simple aggregation of psychological climate in an organization (James 1982; Joyce and Slocum 1984). The question is: How can we aggregate individuals’ descriptions of their work setting so as to represent a larger social unit, the organization? Schneider and Reichers (1983) noted that “hard conceptual work is required prior to data collection so that (a) the clusters of events assessed sample the relevant domain of issues and (b) the survey is relatively descriptive in focus and refers to the unit (i.e., individual, subsystem, total organization) of interest for analytical purposes.” Glick (1985) added that organizational climate should be conceptualized as an organizational phenomenon, not as a simple aggregation of psychological climate. He also acknowledged the existence of multiple units of theory and analysis (i.e., individual, subunit and organizational). Organizational climate connotes an organizational unit of theory; it does not refer to the climate of an individual, workgroup, occupation, department or job. Other labels and units of theory and analysis should be used for the climate of an individual and the climate of a workgroup.
Perceptual agreement among employees in an organization has received considerable attention (Abbey and Dickson 1983; James 1982). Low perceptual agreement on psychological climate measures are attributed to both random error and substantive factors. As employees are asked to report on the organization’s climate and not their psychological or work group climate, many of the individual-level random errors and sources of bias are considered to cancel each other when the perceptual measures are aggregated to the organizational level (Glick 1985). To disentangle psychological and organizational climates and to estimate the relative contributions of organizational and psychological processes as determinants of the organizational and psychological climates, use of multi-level models appears to be crucial (Hox and Kreft 1994; Rabash and Woodhouse 1995). These models take into account psychological and organizational levels without using averaged measures of organizational climates that are usually taken on a representative sample of individuals in a number of organizations. It can be shown (Manson, Wong and Entwisle 1983) that biased estimates of organizational climate averages and of effects of organizational characteristics on climates result from aggregating at the organizational level, measurements taken at the individual level. The belief that individual-level measurement errors are cancelled out when averaged over an organization is unfounded.
Another persistent problem with the concept of climate is the specification of appropriate dimensions of organizational and/or psychological climate. Jones and James (1979) and Schneider (1975a) suggested using climate dimensions that are likely to influence or be associated with the study’s criteria of interest. Schneider and Reichers (1983) extended this idea by arguing that work organizations have different climates for specific things such as safety, service (Schneider, Parkington and Buxton 1980), in-company industrial relations (Bluen and Donald 1991), production, security and quality. Although criterion referencing provides some focus in the choice of climate dimensions, climate remains a broad generic term. The level of sophistication required to be able to identify which dimensions of practices and procedures are relevant for understanding particular criteria in specific collectivities (e.g., groups, positions, functions) has not been reached (Schneider 1975a). However, the call for criterion-oriented studies does not per se rule out the possibility that a relatively small set of dimensions may still describe multiple environments while any particular dimension may be positively related to some criteria, unrelated to others and negatively related to a third set of outcomes.
The safety climate concept
The safety climate concept has been developed in the context of the generally accepted definitions of the organizational and psychological climate. No specific definition of the concept has yet been offered to provide clear guidelines for measurement and theory building. Very few studies have measured the concept, including a stratified sample of 20 industrial organizations in Israel (Zohar 1980), 10 manufacturing and produce companies in the states of Wisconsin and Illinois (Brown and Holmes 1986), 9 construction sites in the state of Maryland (Dedobbeleer and Béland 1991), 16 construction sites in Finland (Mattila, Hyttinen and Rantanen 1994, Mattila, Rantanen and Hyttinen 1994), and among Valencia workers (Oliver, Tomas and Melia 1993; Melia, Tomas and Oliver 1992).
Climate was viewed as a summary of perceptions workers share about their work settings. Climate perceptions summarize an individual’s description of his or her organizational experiences rather than his or her affective evaluative reaction to what has been experienced (Koys and DeCotiis 1991). Following Schneider and Reichers (1983) and Dieterly and Schneider (1974), safety climate models assumed that these perceptions are developed because they are necessary as a frame of reference for gauging the appropriateness of behaviour. Based on a variety of cues present in their work environment, employees were believed to develop coherent sets of perceptions and expectations regarding behaviour-outcome contingencies, and to behave accordingly (Frederiksen, Jensen and Beaton 1972; Schneider 1975a, 1975b).
Table 1 demonstrates some diversity in the type and number of safety climate dimensions presented in validation studies on safety climate. In the general organizational climate literature, there is very little agreement on the dimensions of organizational climate. However, researchers are encouraged to use climate dimensions that are likely to influence or be associated with the study’s criteria of interest. This approach has been successfully adopted in the studies on safety climate. Zohar (1980) developed seven sets of items that were descriptive of organizational events, practices and procedures and which were found to differentiate high- from low-accident factories (Cohen 1977). Brown and Holmes (1986) used Zohar’s 40-item questionnaire, and found a three-factor model instead of the Zohar eight-factor model. Dedobbeleer and Béland used nine variables to measure the three-factor model of Brown and Holmes. The variables were chosen to represent safety concerns in the construction industry and were not all identical to those included in Zohar’s questionnaire. A two-factor model was found. We are left debating whether differences between the Brown and Holmes results and the Dedobbeleer and Béland results are attributable to the use of a more adequate statistical procedure (LISREL weighted least squares procedure with tetrachoric correlations coefficients). A replication was done by Oliver, Tomas and Melia (1993) and Melia, Tomas and Oliver (1992) with nine similar but not identical variables measuring climate perceptions among post-traumatic and pre-traumatic workers from different types of industries. Similar results to those of the Dedobbeleer and Béland study were found.
Table 1. Safety climate measures
|
Author(s) |
Dimensions |
Items |
|
Zohar (1980) |
Perceived importance of safety training |
40 |
|
Brown and Holmes (1986) |
Employee perception of how concerned management is with their well-being |
10 |
|
Dedobbeleer and Béland (1991) |
Management’s commitment and involvement in safety |
9 |
|
Melia, Tomas and Oliver (1992) |
Dedobbeleer and Béland two-factor model |
9 |
|
Oliver, Tomas and Melia (1993) |
Dedobbeleer and Béland two-factor model |
9 |
Several strategies have been used for improving the validity of safety climate measures. There are different types of validity (e.g., content, concurrent and construct) and several ways to evaluate the validity of an instrument. Content validity is the sampling adequacy of the content of a measuring instrument (Nunnally 1978). In safety climate research, the items are those shown by previous research to be meaningful measures of occupational safety. Other “competent” judges usually judge the content of the items, and then some method for pooling these independent judgements is used. There is no mention of such a procedure in the articles on safety climate.
Construct validity is the extent to which an instrument measures the theoretical construct the researcher wishes to measure. It requires a demonstration that the construct exists, that it is distinct from other constructs, and that the particular instrument measures that particular construct and no others (Nunnally 1978). Zohar’s study followed several suggestions for improving validity. Representative samples of factories were chosen. A stratified random sample of 20 production workers was taken in each plant. All questions focused on organizational climate for safety. To study the construct validity of his safety climate instrument, he used Spearman rank correlation coefficients to test the agreement between safety climate scores of factories and safety inspectors’ ranking of the selected factories in each production category according to safety practices and accident-prevention programmes. The level of safety climate was correlated with safety programme effectiveness as judged by safety inspectors. Using LISREL confirmatory factor analyses, Brown and Holmes (1986) checked the factorial validity of the Zohar measurement model with a sample of US workers. They wanted to validate Zohar’s model by the recommended replication of factor structures (Rummel 1970). The model was not supported by the data. A three-factor model provided a better fit. Results also indicated that the climate structures showed stability across different populations. They did not differ between employees who had accidents and those who had none, subsequently providing a valid and reliable climate measure across the groups. Groups were then compared on climate scores, and differences in climate perception were detected between the groups. As the model has the ability of distinguishing individuals who are known to differ, concurrent validity has been shown.
In order to test the stability of the Brown and Holmes three-factor model (1986), Dedobbeleer and Béland (1991) used two LISREL procedures (the maximum likelihood method chosen by Brown and Holmes and the weighted least squares method) with construction workers. Results revealed that a two-factor model provided an overall better fit. Construct validation was also tested by investigating the relationship between a perceptual safety climate measure and objective measures (i.e., structural and processes characteristics of the construction sites). Positive relationships were found between the two measures. Evidence was gathered from different sources (i.e., workers and superintendents) and in different ways (i.e., written questionnaire and interviews). Mattila, Rantanen and Hyttinen (1994) replicated this study by showing that similar results were obtained from the objective measurements of the work environment, resulting in a safety index, and the perceptual safety climate measures.
A systematic replication of the Dedobbeleer and Béland (1991) bifactorial structure was done in two different samples of workers in different occupations by Oliver, Tomas and Melia (1993) and Melia, Tomas and Oliver (1992). The two-factor model provided the best global fit. The climate structures did not differ between US construction workers and Spanish workers from different types of industries, subsequently providing a valid climate measure across different populations and different types of occupations.
Reliability is an important issue in the use of a measurement instrument. It refers to the accuracy (consistency and stability) of measurement by an instrument (Nunnally 1978). Zohar (1980) assessed organizational climate for safety in samples of organizations with diverse technologies. The reliability of his aggregated perceptual measures of organizational climate was estimated by Glick (1985). He calculated the aggregate level mean rater reliability by using the Spearman-Brown formula based on the intraclass correlation from a one-way analysis of variance, and found an ICC(1,k) of 0.981. Glick concluded that Zohar’s aggregated measures were consistent measures of organizational climate for safety. The LISREL confirmatory factor analyses conducted by Brown and Holmes (1986), Dedobbeleer and Béland (1991), Oliver, Tomas and Melia (1993) and Melia, Tomas and Oliver (1992) also showed evidence of the reliability of the safety climate measures. In the Brown and Holmes study, the factor structures remained the same for no accident versus accident groups. Oliver et al. and Melia et al. demonstrated the stability of the Dedobbeleer and Béland factor structures in two different samples.
Safety Policy and Safety Climate
The concept of safety climate has important implications for industrial organizations. It implies that workers have a unified set of cognitions regarding the safety aspects of their work settings. As these cognitions are seen as a necessary frame of reference for gauging the appropriateness of behaviour (Schneider 1975a), they have a direct influence on workers’ safety performance (Dedobbeleer, Béland and German 1990). There are thus basic applied implications of the safety climate concept in industrial organizations. Safety climate measurement is a practical tool that can be used by management at low cost to evaluate as well as recognize potential problem areas. It should thus be recommended to include it as one element of an organization’s safety information system. The information provided may serve as guidelines in the establishment of a safety policy.
As workers’ safety climate perceptions are largely related to management’s attitudes about safety and management’s commitment to safety, it can therefore be concluded that a change in management’s attitudes and behaviours are prerequisites for any successful attempt at improving the safety level in industrial organizations. Excellent management becomes safety policy. Zohar (1980) concluded that safety should be integrated in the production system in a manner which is closely related to the overall degree of control that management has over the production processes. This point has been stressed in the literature regarding safety policy. Management involvement is seen as critical to safety improvement (Minter 1991). Traditional approaches show limited effectiveness (Sarkis 1990). They are based on elements such as safety committees, safety meetings, safety rules, slogans, poster campaigns and safety incentives or contests. According to Hansen (1993b), these traditional strategies place safety responsibility with a staff coordinator who is detached from the line mission and whose task is almost exclusively to inspect the hazards. The main problem is that this approach fails to integrate safety into the production system, thereby limiting its ability to identify and resolve management oversights and insufficiencies that contribute to accident causation (Hansen 1993b; Cohen 1977).
Contrary to production workers in the Zohar and Brown and Holmes studies, construction workers perceived management’s safety attitudes and actions as one single dimension (Dedobbeleer and Béland 1991). Construction workers also perceived safety as a joint responsibility between individuals and management. These results have important implications for the development of safety policies. They suggest that management’s support and commitment to safety should be highly visible. Moreover, they indicate that safety policies should address the safety concerns of both management and workers. Safety meetings as the “cultural circles” of Freire (1988) can be a proper means for involving workers in the identification of safety problems and solutions to these problems. Safety climate dimensions are thus in close relationship with the partnership mentality to improve job safety, contrasting with the police enforcement mentality that was present in the construction industry (Smith 1993). In the context of expanding costs of health care and workers’ compensation, a non-adversarial labour-management approach to health and safety has emerged (Smith 1993). This partnership approach thus calls for a safety-management revolution, moving away from traditional safety programmes and safety policies.
In Canada, Sass (1989) indicated the strong resistance by management and government to extension of workers’ rights in occupational health and safety. This resistance is based upon economic considerations. Sass therefore argued for “the development of an ethics of the work environment based upon egalitarian principles, and the transformation of the primary work group into a community of workers who can shape the character of their work environment.” He also suggested that the appropriate relationship in industry to reflect a democratic work environment is “partnership”, the coming together of the primary work groups as equals. In Quebec, this progressive philosophy has been operationalized in the establishment of “parity committees” (Gouvernement du Québec 1978). According to law, each organization having more than ten employees had to create a parity committee, which includes employer’s and workers’ representatives. This committee has decisive power in the following issues related to the prevention programme: determination of a health services programme, choice of the company physician, ascertainment of imminent dangers and the development of training and information programmes. The committee is also responsible for preventive monitoring in the organization; responding to workers’ and employer’s complaints; analysing and commenting on accident reports; establishing a registry of accidents, injuries, diseases and workers’ complaints; studying statistics and reports; and communicating information on the committee’s activities.
Leadership and Safety Climate
To make things happen that enable the company to evolve toward new cultural assumptions, management has to be willing to go beyond “commitment” to participatory leadership (Hansen 1993a). The workplace thus needs leaders with vision, empowerment skills and a willingness to cause change.
Safety climate is created by the actions of leaders. This means fostering a climate where working safely is esteemed, inviting all employees to think beyond their own particular jobs, to take care of themselves and their co-workers, propagating and cultivating leadership in safety (Lark 1991). To induce this climate, leaders need perception and insight, motivation and skill to communicate dedication or commitment to the group beyond self-interest, emotional strength, ability to induce “cognition redefinition” by articulating and selling new visions and concepts, ability to create involvement and participation, and depth of vision (Schein 1989). To change any elements of the organization, leaders must be willing to “unfreeze” (Lewin 1951) their own organization.
According to Lark (1991), leadership in safety means at the executive level, creating an overall climate in which safety is a value and in which supervisors and non-supervisors conscientiously and in turn take the lead in hazard control. These executive leaders publish a safety policy in which they: affirm the value of each employee and of the group, and their own commitment to safety; relate safety to the continuance of the company and the achievement of its objectives; express their expectations that each individual will be responsible for safety and take an active part in keeping the workplace healthy and safe; appoint a safety representative in writing and empower this individual to execute corporate safety policy.
Supervisor leaders expect safe behaviour from subordinates and directly involve them in the identification of problems and their solutions. Leadership in safety for the non-supervisor means reporting deficiencies, seeing corrective actions as a challenge, and working to correct these deficiencies.
Leadership challenges and empowers people to lead in their own right. At the core of this notion of empowerment is the concept of power, defined as the ability to control the factors that determine one’s life. The new health promotion movement, however, attempts to reframe power not as “power over” but rather as “power to” or as “power with” (Robertson and Minkler 1994).
Conclusions
Only some of the conceptual and methodological problems plaguing organizational climate scientists are being addressed in safety climate research. No specific definition of the safety climate concept has yet been given. Nevertheless, some of the research results are very encouraging. Most of the research efforts have been directed toward validation of a safety climate model. Attention has been given to the specification of appropriate dimensions of safety climate. Dimensions suggested by the literature on organizational characteristics found to discriminate high versus low accident rate companies served as a useful starting point for the dimension identification process. Eight-, three- and two-factor models are proposed. As Occam’s razor demands some parsimony, the limitation of the dimensions seems pertinent. The two-factor model is thus most appropriate, in particular in a work context where short questionnaires need to be administered. The factor analytic results for the scales based on the two dimensions are very satisfactory. Moreover, a valid climate measure is provided across different populations and different occupations. Further studies should, however, be conducted if the replication and generalization rules of theory testing are to be met. The challenge is to specify a theoretically meaningful and analytically practical universe of possible climate dimensions. Future research should also focus on organizational units of analysis in assessing and improving the validity and reliability of the organizational climate for safety measures. Several studies are being conducted at this moment in different countries, and the future looks promising.
As the safety climate concept has important implications for safety policy, it becomes particularly crucial to resolve the conceptual and methodological problems. The concept clearly calls for a safety-management revolution. A process of change in management attitudes and behaviours becomes a prerequisite to attaining safety performance. “Partnership leadership” has to emerge from this period where restructuring and layoffs are a sign of the times. Leadership challenges and empowers. In this empowerment process, employers and employees will increase their capacity to work together in a participatory manner. They will also develop skills of listening and speaking up, problem analysis and consensus building. A sense of community should develop as well as self-efficacy. Employers and employees will be able to build on this knowledge and these skills.
Participatory Workplace Improvement Process
Behaviour Modification: A Safety Management Technique
Safety management has two main tasks. It is incumbent on the safety organization (1) to maintain the company’s safety performance on the current level and (2) to implement measures and programmes which improve the safety performance. The tasks are different and require different approaches. This article describes a method for the second task which has been used in numerous companies with excellent results. The background of this method is behaviour modification, which is a technique for improving safety which has many applications in business and industry. Two independently conducted experiments of the first scientific applications of behaviour modification were published by Americans in 1978. The applications were in quite different locations. Komaki, Barwick and Scott (1978) did their study in a bakery. Sulzer-Azaroff (1978) did her study in laboratories at a university.
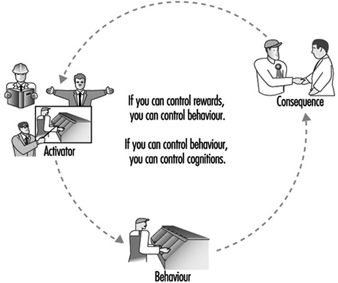
Consequences of Behaviour
Behaviour modification puts the focus on the consequences of a behaviour. When workers have several behaviours to opt for, they choose the one which will be expected to bring about more positive consequences. Before action, the worker has a set of attitudes, skills, equipment and facility conditions. These have an influence on the choice of action. However, it is primarily what follows the action as foreseeable consequences that determines the choice of behaviour. Because the consequences have an effect on attitudes, skills and so on, they have the predominant role in inducing a change in behaviour, according to the theorists (figure 1).
Figure 1. Behaviour modification: a safety management technique
The problem in the safety area is that many unsafe behaviours lead workers to choose more positive consequences (in the sense of apparently rewarding the worker) than safe behaviours. An unsafe work method may be more rewarding if it is quicker, perhaps easier, and induces appreciation from the supervisor. The negative consequence—for instance, an injury—does not follow each unsafe behaviour, as injuries require other adverse conditions to exist before they can take place. Therefore positive consequences are overwhelming in their number and frequency.
As an example, a workshop was conducted in which the participants analysed videos of various jobs at a production plant. These participants, engineers and machine operators from the plant, noticed that a machine was operated with the guard open. “You cannot keep the guard closed”, claimed an operator. “If the automatic operation ceases, I press the limit switch and force the last part to come out of the machine”, he said. “Otherwise I have to take the unfinished part out, carry it several metres and put it back to the conveyor. The part is heavy; it is easier and faster to use the limit switch.”
This little incident illustrates well how the expected consequences affect our decisions. The operator wants to do the job fast and avoid lifting a part that is heavy and difficult to handle. Even if this is more risky, the operator rejects the safer method. The same mechanism applies to all levels in organizations. A plant manager, for example, likes to maximize the profit of the operation and be rewarded for good economic results. If top management does not pay attention to safety, the plant manager can expect more positive consequences from investments which maximize production than those which improve safety.
Positive and Negative Consequences
Governments give rules to economic decision makers through laws, and enforce the laws with penalties. The mechanism is direct: any decision maker can expect negative consequences for breach of law. The difference between the legal approach and the approach advocated here is in the type of consequences. Law enforcement uses negative consequences for unsafe behaviour, while behaviour modification techniques use positive consequences for safe behaviour. Negative consequences have their drawbacks even if they are effective. In the area of safety, the use of negative consequences has been common, extending from government penalties to supervisor’s reprimand. People try to avoid penalties. By doing it, they easily associate safety with penalties, as something less desirable.
Positive consequences reinforcing safe behaviour are more desirable, as they associate positive feelings with safety. If operators can expect more positive consequences from safe work methods, they choose this more as a likely role of behaviour. If plant managers are appraised and rewarded on the basis of safety, they will most likely give a higher value to safety aspects in their decisions.
The array of possible positive consequences is wide. They extend from social attention to various privileges and tokens. Some of the consequences can easily be attached to behaviour; some others demand administrative actions which may be overwhelming. Fortunately, just the chance of being rewarded can change performance.
Changing Unsafe Behaviour to Safe Behaviour
What was especially interesting in the original work of Komaki, Barwick and Scott (1978) and of Sulzer-Azaroff (1978) was the use of performance information as the consequence. Rather than using social consequences or tangible rewards, which may be difficult to administer, they developed a method to measure the safety performance of a group of workers, and used the performance index as the consequence. The index was constructed so that it was just a single figure that varied between 0 and 100. Being simple, it effectively communicated the message about current performance to those concerned. The original application of this technique aimed just at getting employees to change their behaviour. It did not address any other aspects of workplace improvement, such as eliminating problems by engineering, or introducing procedural changes. The programme was implemented by researchers without the active involvement of workers.
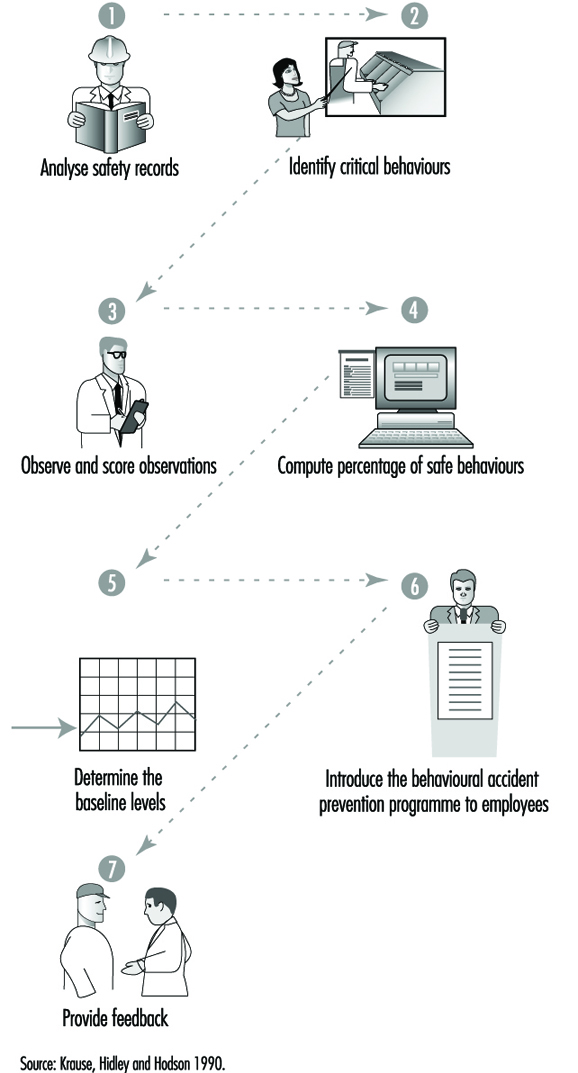
The users of the behaviour modification (BM) technique assume unsafe behaviour to be an essential factor in accident causation, and a factor which can change in isolation without subsequent effects. Therefore, the natural starting point of a BM programme is the investigation of accidents for the identification of unsafe behaviours (Sulzer-Azaroff and Fellner 1984). A typical application of safety-related behaviour modification consists of the steps given in figure 2. The safe acts have to be specified precisely, according to the developers of the technique. The first step is to define which are the correct acts in an area such as a department, a supervisory area and so on. Wearing safety glasses appropriately in certain areas would be an example of a safe act. Usually, a small number of specific safe acts—for example, ten—are defined for a behaviour modification programme.
Figure 2. Behaviour modification for safety consists of the following steps
A few other examples of typical safe behaviours are:
- In working on a ladder, it should be tied off.
- In working on a catwalk, one should not lean over the railing.
- Lockouts should be used during electrical maintenance.
- Protective equipment should be worn.
- A fork-lift should be driven up or down a ramp with the boom in its proper position (Krause, Hidley and Hodgson 1990; McSween 1995).
If a sufficient number of people, typically from 5 to 30, work in a given area, it is possible to generate an observation checklist based on unsafe behaviours. The main principle is to choose checklist items which have only two values, correct or incorrect. If wearing safety glasses is one of the specified safe acts, it would be appropriate to observe every person separately and determine whether or not they are wearing safety glasses. This way the observations provide objective and clear data about the prevalence of safe behaviour. Other specified safe behaviours provide other items for inclusion in the observation checklist. If the list consists, for example, of one hundred items, it is easy to calculate a safety performance index of the percentage of those items which are marked correct, after the observation is completed. The performance index usually varies from time to time.
When the measurement technique is ready, the users determine the baseline. Observation rounds are done at random times weekly (or for several weeks). When a sufficient number of observation rounds are done there is a reasonable picture of the variations of the baseline performance. This is necessary for the positive mechanisms to work. The baseline should be around 50 to 60% to give a positive starting point for improvement and to acknowledge previous performance. The technique has proven its effectiveness in changing safety behaviour. Sulzer-Azaroff, Harris and McCann (1994) list in their review 44 published studies showing a definite effect on behaviour. The technique seems to work almost always, with a few exceptions, as mentioned in Cooper et al. 1994.
Practical Application of Behavioural Theory
Because of several drawbacks in behaviour modification, we developed another technique which aims at rectifying some of the drawbacks. The new programme is called Tuttava, which is an acronym for the Finnish words safely productive. The major differences are shown in the table 1.
Table 1. Differences between Tuttava and other programme/techniques
|
Aspect |
Behaviour modification for safety |
Participatory workplace improvement process, Tuttava |
|
Basis |
Accidents, incidents, risk perceptions |
Work analysis, work flow |
|
Focus |
People and their behaviour |
Conditions |
|
Implementation Experts, consultants |
Joint employee-management team |
|
|
Effect |
Temporary |
Sustainable |
|
Goal |
Behavioural change |
Fundamental and cultural change |
The underlying safety theory in behavioural safety programmes is very simple. It assumes that there is a clear line between safe and unsafe. Wearing safety glasses represents safe behaviour. It does not matter that the optical quality of the glasses may be poor or that the field of vision may be reduced. More generally, the dichotomy between safe and unsafe may be a dangerous simplification.
The receptionist at a plant asked me to remove my ring for a plant tour. She committed a safe act by asking me to remove my ring, and I, by doing so. The wedding ring has, however, a high emotional value to me. Therefore I was worried about losing my ring during the tour. This took part of my perceptual and mental energy away from observing the surrounding area. I was less observant and therefore my risk of being hit by a passing fork-lift truck was higher than usual.
The “no rings” policy originated probably from a past accident. Similar to the wearing of safety glasses, it is far from clear that it itself represents safety. Accident investigations, and people concerned, are the most natural source for the identification of unsafe acts. But this may be very misleading. The investigator may not really understand how an act contributed to the injury under investigation. Therefore, an act labelled “unsafe” may not really be generally speaking unsafe. For this reason, the application developed herein (Saari and Näsänen 1989) defines the behavioural targets from a work analysis point of view. The focus is on tools and materials, because the workers handle those every day and it is easy for them to start talking about familiar objects.
Observing people by direct methods leads easily to blame. Blame leads to organizational tension and antagonism between management and labour, and it is not beneficial for continuous safety improvements. It is therefore better to focus on physical conditions rather than try to coerce behaviour directly. Targeting the application to behaviours related to handling materials and tools, will make any relevant change highly visible. The behaviour itself may last only a second, but it has to leave a visible mark. For example, putting a tool back in its designated place after use takes a very short time. The tool itself remains visible and observable, and there is no need to observe the behaviour itself.
The visible change provides two benefits: (1) it becomes obvious to everybody that improvements happen and (2) people learn to read their performance level directly from their environment. They do not need the results of observation rounds in order to know their current performance. This way, the improvements start acting as positive consequences with respect to correct behaviour, and the artificial performance index becomes unnecessary.
The researchers and external consultants are the main actors in the application described previously. The workers need not think about their work; it is enough if they change their behaviour. However, for obtaining deeper and more lasting results, it would be better if they were involved in the process. Therefore, the application should integrate both workers and management, so that the implementation team consists of representatives from both sides. It also would be nice to have an application which gives lasting results without continuous measurements. Unfortunately, the normal behaviour modification programme does not create highly visible changes, and many critical behaviours last only a second or fractions of a second.
The technique does have some drawbacks in the form described. In theory, relapse to baseline should occur when the observation rounds are terminated. The resources for developing the programme and carrying out observation may be too extensive in comparison with the temporary change gained.
Tools and materials provide a sort of window into the quality of the functions of an organization. For example, if too many components or parts clutter a workstation it may be an indication about problems in the firm’s purchasing process or in the suppliers’ procedures. The physical presence of excessive parts is a concrete way of initiating discussion about organizational functions. The workers who are especially not used to abstract discussions about organizations, can participate and bring their observations into the analysis. Tools and materials often provide an avenue to the underlying, more hidden factors contributing to accident risks. These factors are typically organizational and procedural by nature and, therefore, difficult to address without concrete and substantive informational matter.
Organizational malfunctions may also cause safety problems. For example, in a recent plant visit, workers were observed lifting products manually onto pallets weighing several tons all together. This happened because the purchasing system and the supplier’s system did not function well and, consequently, the product labels were not available at the right time. The products had to be set aside for days on pallets, obstructing an aisle. When the labels arrived, the products were lifted, again manually, to the line. All this was extra work, work which contributes to the risk of back or other injury.
Four Conditions Have to Be Satisfied in a Successful Improvement Programme
To be successful, one must possess correct theoretical and practical understanding about the problem and the mechanisms behind it. This is the foundation for setting the goals for improvement, following which (1) people have to know the new goals, (2) they have to have the technical and organizational means for acting accordingly and (3) they have to be motivated (figure 3). This scheme applies to any change programme.
Figure 3. The four steps of a successful safety programme
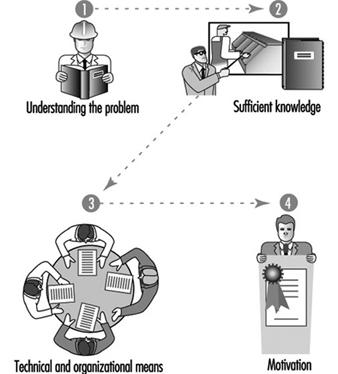
A safety campaign may be a good instrument for efficiently spreading information about a goal. However, it has an effect on people’s behaviour only if the other criteria are satisfied. Requiring the wearing of hard hats has no effect on a person who does not have a hard hat, or if a hard hat is terribly uncomfortable, for example, because of a cold climate. A safety campaign may also aim at increasing motivation, but it will fail if it just sends an abstract message, such as “safety first”, unless the recipients have the skills to translate the message into specific behaviours. Plant managers who are told to reduce injuries in the area by 50% are in a similar situation if they do not understand anything about accident mechanisms.
The four criteria set out in figure 3 have to be met. For example, an experiment was conducted in which people were supposed to use stand-alone screens to prevent welding light from reaching other workers’ areas. The experiment failed because it was not realized that no adequate organizational agreements were made. Who should put the screen up, the welder or the other nearby worker exposed to the light? Because both worked on a piece-rate basis and did not want to waste time, an organizational agreement about compensation should have been made before the experiment. A successful safety programme has to address all these four areas simultaneously. Otherwise, progress will be limited.
Tuttava Programme
The Tuttava programme (figure 4) lasts from 4 to 6 months and covers the working area of 5 to 30 people at a time. It is done by a team consisting of the representatives of management, supervisors and workers.
Figure 4. The Tuttava programme consists of four stages and eight steps
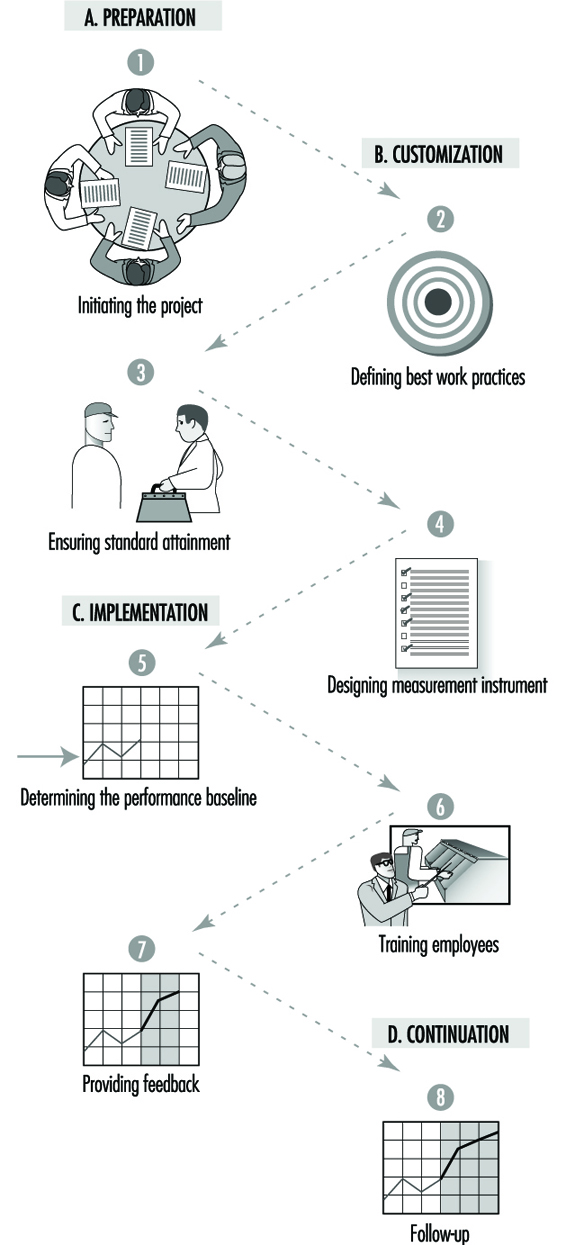
Performance targets
The first step is to prepare a list of performance targets, or best work practices, consisting of about ten well-specified targets (table 2). The targets should be (1) positive and make work easier, (2) generally acceptable, (3) simple and briefly stated, (4) expressed at the start with action verbs to emphasize the important items to be done and (5) easy to observe and measure.
Table 2. An example of best work practices
- Keep gangways, aisles clear.
- Keep tools stored in proper places when not in use.
- Use proper containers and disposal methods for chemicals.
- Store all manuals at right place after use.
- Make sure of the right calibration on measuring instruments.
- Return trolleys, buggies, pallets at proper location after use.
- Take only right quantity of parts (bolts, nuts, etc.) from bins and return any unused items
- back in proper place.
- Remove from pockets any loose objects that may fall without notice.
The key words for specifying the targets are tools and materials. Usually the targets refer to goals such as the proper placement of materials and tools, keeping the aisles open, correcting leaks and other process disturbances right away, and keeping free access to fire extinguishers, emergency exits, electric substations, safety switches and so on. The performance targets at a printing ink factory are given in table 3.
Table 3. Performance targets at a printing ink factory
- Keep aisles open.
- Always put covers on containers when possible.
- Close bottles after use.
- Clean and return tools after use.
- Ground containers when moving flammable substances.
- Use personal protection as specified.
- Use local exhaust ventilation.
- Store in working areas only materials and substances needed immediately.
- Use only the designated fork-lift truck in the department making flexographic printing inks.
- Label all containers.
These targets are comparable to the safe behaviours defined in the behaviour modification programmes. The difference is that Tuttava behaviours leave visible marks. Closing bottles after use may be a behaviour which takes less than a minute. However, it is possible to see if this was done or not by observing the bottles not in use. There is no need to observe people, a fact which is important for avoiding fingerpointing and blame.
The targets define the behavioural change that the team expects from the employees. In this sense, they compare with the safe behaviours in behaviour modification. However, most of the targets refer to things which are not only workers’ behaviours but which have a much wider meaning. For example, the target may be to store only immediately needed materials in the work area. This requires an analysis of the work process and an understanding of it, and may reveal problems in the technical and organizational arrangements. Sometimes, the materials are not stored conveniently for daily use. Sometimes, the delivery systems work so slowly or are so vulnerable to disturbances that employees stockpile too much material in the work area.
Observation checklist
When the performance targets are sufficiently well defined, the team designs an observation checklist to measure to what extent the targets are met. About 100 measurement points are chosen from the area. For example, the number of measurement points was 126 in the printing ink factory. In each point, the team observes one or several specific items. For example, as regards a waste container, the items could be (1) is the container not too full, (2) is the right kind of waste put into it or (3) is the cover on, if needed? Each item can only be either correct or incorrect. Dichotomized observations make the measurement system objective and reliable. This allows one to calculate a performance index after an observation round covering all measurement points. The index is simply the percentage of items assessed correct. The index can, quite obviously, range from 0 to 100, and it indicates directly to what degree the standards are met. When the first draft of the observation checklist is available, the team conducts a test round. If the result is around 50 to 60%, and if each member of the team gets about the same result, the team can move on to the next phase of Tuttava. If the result of the first observation round is too low—say, 20%—then the team revises the list of performance targets. This is because the programme should be positive in every aspect. Too low a baseline would not adequately assess previous performance; it would rather merely set the blame for poor performance. A good baseline is around 50%.
Technical, organizational and procedural improvements
A very important step in the programme is ensuring the attainment of the performance targets. For example, waste may be lying on floors simply because the number of waste containers is insufficient. There may be excessive materials and parts because the supply system does not work. The system has to become better before it is correct to demand a behavioural change from the workers. By examining each of the targets for attainability, the team usually identifies many opportunities for technical, organizational and procedural improvements. In this way, the worker members bring their practical experience into the development process.
Because the workers spend the entire day at their workplace, they have much more knowledge about the work processes than management. Analysing the attainment of the performance targets, the workers get the opportunity to communicate their ideas to management. As improvements then take place, the employees are much more receptive to the request to meet the performance targets. Usually, this step leads to easily manageable corrective actions. For example, products were removed from the line for adjustments. Some of the products were good, some were bad. The production workers wanted to have designated areas marked for good and bad products so as to know which products to put back on the line and which ones to send for recycling. This step may also call for major technical modifications, such as a new ventilation system in the area where the rejected products are stored. Sometimes, the number of modifications is very high. For example, over 300 technical improvements were made in a plant producing oil-based chemicals which employs only 60 workers. It is important to manage the implementation of improvements well to avoid frustration and the overloading of the respective departments.
Baseline measurements
Baseline observations are started when the attainment of performance targets is sufficiently ensured and when the observation checklist is reliable enough. Sometimes, the targets need revisions, as improvements take a longer time. The team conducts weekly observation rounds for a few weeks to determine the prevailing standard. This phase is important, because it makes it possible to compare the performance at any later time to the initial performance. People forget easily how things were just a couple of months in the past. It is important to have the feeling of progress to reinforce continuous improvements.
Feedback
As the next step, the team trains all people in the area. It is usually done in a one-hour seminar. This is the first time when the results of the baseline measurements are made generally known. The feedback phase starts immediately after the seminar. The observation rounds continue weekly. Now, the result of the round is immediately made known to everybody by posting the index on a chart placed in a visible location. All critical remarks, blame or other negative comments are strictly forbidden. Although the team will identify individuals not behaving as specified in the targets, the team is instructed to keep the information to themselves. Sometimes, all employees are integrated into the process from the very beginning, especially if the number of people working in the area is small. This is better than having representative implementation teams. However, it may not be feasible everywhere.
Effects on performance
Change happens within a couple of weeks after the feedback starts (figure 5). People start to keep the worksite in visibly better order. The performance index jumps typically from 50 to 60% and then even to 80 or 90%. This may not sound big in absolute terms, but it is a big change on the shop floor.
Figure 5. The results from a department at a shipyard
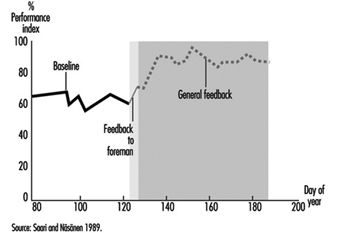
As the performance targets refer on purpose not only to safety issues, the benefits extend from better safety to productivity, saving of materials and floor footage, better physical appearance and so on. To make the improvements attractive to all, there are targets which integrate safety with other goals, such as productivity and quality. This is necessary to make safety more attractive for the management, who in this way will also provide funding more willingly for the less important safety improvements
Sustainable results
When the programme was first developed, 12 experiments were conducted to test the various components. Follow-up observations were made at a shipyard for 2 years. The new level of performance was well kept up during the 2-year follow-up. The sustainable results separate this process from normal behaviour modification. The visible changes in the location of materials, tools and so on, and the technical improvements deter the already secured improvement from fading away. When 3 years had gone by, an evaluation of the effect on accidents at the shipyard was made. The result was dramatic. Accidents had gone down by from 70 to 80%. This was much more than could be expected on the basis of the behavioural change. The number of accidents totally unrelated to performance targets went down as well.
The major effect on accidents is not attributable to the direct changes the process achieves. Rather, this is a starting point for other processes to follow. As Tuttava is very positive and as it brings noticeable improvements, the relations between management and labour get better and the teams get encouragement for other improvements.
Cultural change
A large steel mill was one of the numerous users of Tuttava, the primary purpose of which is to change safety culture. When they started in l987 there were 57 accidents per million hours worked. Prior to this, safety management relied heavily on commands from the top. Unfortunately, the president retired and everybody forgot safety, as the new management could not create a similar demand for safety culture. Among middle management, safety was considered negatively as something extra to be done because of the president’s demand. They organized ten Tuttava teams in l987, and new teams were added every year after that. Now, they have less than 35 accidents per million hours worked, and production has steadily increased during these years. The process caused the safety culture to improve as the middle managers saw in their respective departments improvements which were simultaneously good for safety and production. They became more receptive to other safety programmes and initiatives.
The practical benefits were big. For example, the maintenance service department of the steel mill, employing 300 people, reported a reduction of 400 days in the number of days lost due to occupational injuries—in other words, from 600 days to 200 days. The absenteeism rate fell also by one percentage point. The supervisors said that “it is nicer to come to a workplace which is well organized, both materially and mentally”. The investment was just a fraction of the economic benefit.
Another company employing 1,500 people reported the release of 15,000 m2 of production area, since materials, equipment and so forth, are stored in a better order. The company paid US$1.5 million less in rent. A Canadian company saves about 1 million Canadian dollars per year because of reduced material damages resulting from the implementation of Tuttava.
These are results which are possible only through a cultural change. The most important element in the new culture is shared positive experiences. A manager said, “You can buy people’s time, you can buy their physical presence at a given place, you can even buy a measured number of their skilled muscular motions per hour. But you cannot buy loyalty, you cannot buy the devotion of hearts, minds, or souls. You must earn them.” The positive approach of Tuttava helps managers to earn the loyalty and the devotion of their working teams. Thereby the programme helps involve employees in subsequent improvement projects.
Methods of Safety Decision Making
A company is a complex system where decision making takes place in many connections and under various circumstances. Safety is only one of a number of requirements managers must consider when choosing among actions. Decisions relating to safety issues vary considerably in scope and character depending on the attributes of the risk problems to be managed and the decision maker’s position in the organization.
Much research has been undertaken on how people actually make decisions, both individually and in an organizational context: see, for instance, Janis and Mann (1977); Kahnemann, Slovic and Tversky (1982); Montgomery and Svenson (1989). This article will examine selected research experience in this area as a basis for decision-making methods used in management of safety. In principle, decision making concerning safety is not much different from decision making in other areas of management. There is no simple method or set of rules for making good decisions in all situations, since the activities involved in safety management are too complex and varied in scope and character.
The main focus of this article will not be on presenting simple prescriptions or solutions but rather to provide more insight into some of the important challenges and principles for good decision making concerning safety. An overview of the scope, levels and steps in problem solving concerning safety issues will be given, mainly based on the work by Hale et al. (1994). Problem solving is a way of identifying the problem and eliciting viable remedies. This is an important first step in any decision process to be examined. In order to put the challenges of real-life decisions concerning safety into perspective, the principles of rational choice theory will be discussed. The last part of the article covers decision making in an organizational context and introduces the sociological perspective on decision making. Also included are some of the main problems and methods of decision making in the context of safety management, so as to provide more insight into the main dimensions, challenges and pitfalls of making decisions on safety issues as an important activity and challenge in management of safety.
The Context of Safety Decision Making
A general presentation of the methods of safety decision making is complicated because both safety issues and the character of the decision problems vary considerably over the lifetime of an enterprise. From concept and establishment to closure, the life cycle of a company may be divided into six main stages:
- design
- construction
- commissioning
- operation
- maintenance and modification
- decomposition and demolition.
Each of the life-cycle elements involves decisions concerning safety which are not only specific to that phase alone but which also impact on some or all of the other phases. During design, construction and commissioning, the main challenges concern the choice, development and realization of the safety standards and specifications that have been decided upon. During operation, maintenance and demolition, the main objectives of safety management will be to maintain and possibly improve the determined level of safety. The construction phase also represents a “production phase” to some extent, because at the same time that construction safety principles must be adhered to, the safety specifications for what is being built must be realized.
Safety Management Decision Levels
Decisions about safety also differ in character depending on organizational level. Hale et al. (1994) distinguish among three main decision levels of safety management in the organization:
The level of execution is the level at which the actions of those involved (workers) directly influence the occurrence and control of hazards in the workplace. This level is concerned with the recognition of the hazards and the choice and implementation of actions to eliminate, reduce and control them. The degrees of freedom present at this level are limited; therefore, feedback and correction loops are concerned essentially with correcting deviations from established procedures and returning practice to a norm. As soon as a situation is identified where the norm agreed upon is no longer thought to be appropriate, the next higher level is activated.
The level of planning, organization and procedures is concerned with devising and formalizing the actions to be taken at the execution level in respect to the entire range of expected hazards. The planning and organization level, which sets out responsibilities, procedures, reporting lines and so on, is typically found in safety manuals. It is this level which develops new procedures for hazards new to the organization, and modifies existing procedures to keep up either with new insights about hazards or with standards for solutions relating to hazards. This level involves the translation of abstract principles into concrete task allocation and implementation, and corresponds to the improvement loop required in many quality systems.
The level of structure and management is concerned with the overall principles of safety management. This level is activated when the organization considers that the current planning and organizing levels are failing in fundamental ways to achieve accepted performance. It is the level at which the “normal” functioning of the safety management system is critically monitored and through which it is continually improved or maintained in face of changes in the external environment of the organization.
Hale et al. (1994) emphasize that the three levels are abstractions corresponding to three different kinds of feedback. They should not be seen as contiguous with the hierarchical levels of shop floor, first line and higher management, as the activities specified at each abstract level can be applied in many different ways. The way task allocations are made reflects the culture and methods of working of the individual company.
Safety Decision-Making Process
Safety problems must be managed through some kind of problem-solving or decision-making process. According to Hale et al. (1994) this process, which is designated the problem-solving cycle, is common to the three levels of safety management described above. The problem-solving cycle is a model of an idealized stepwise procedure for analysing and making decisions on safety problems caused by potential or actual deviations from desired, expected or planned achievements (figure 1).
Figure 1. The problem-solving cycle
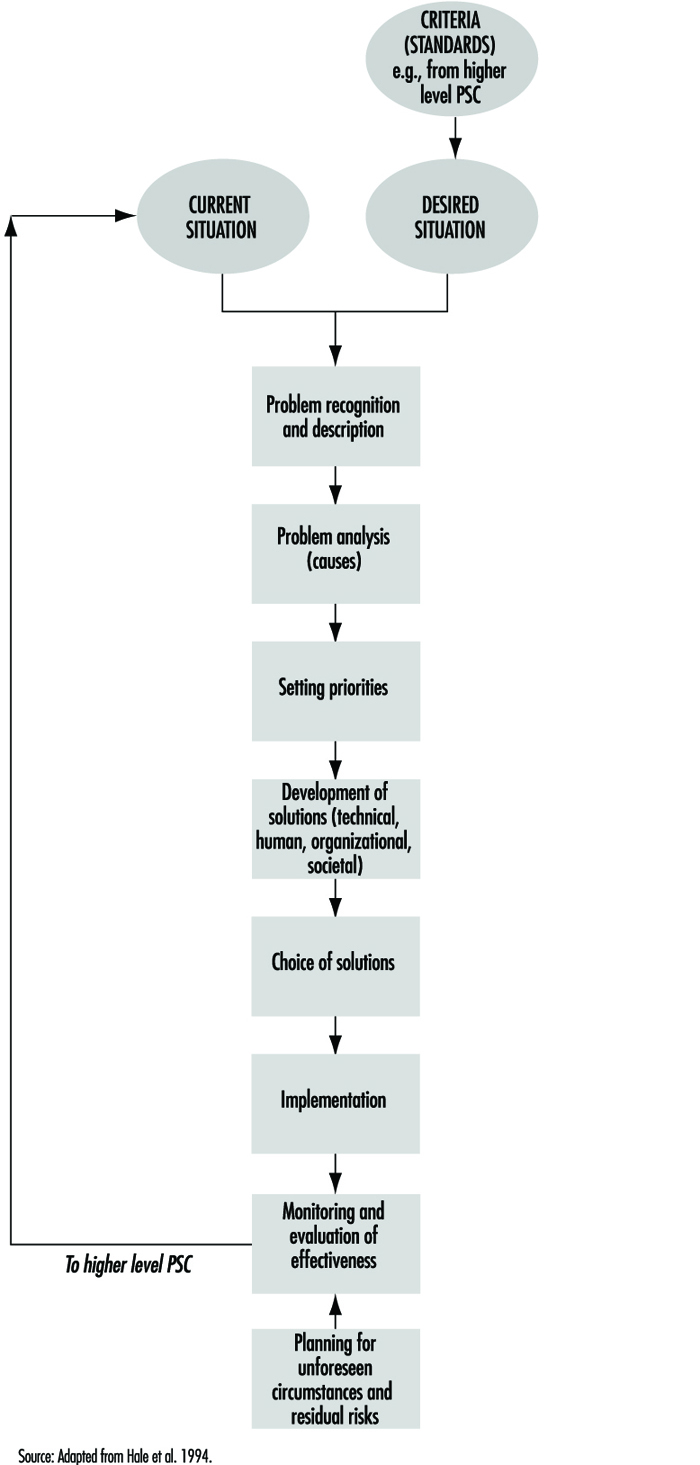
Although the steps are the same in principle at all three safety management levels, the application in practice may differ somewhat depending on the nature of problems treated. The model shows that decisions which concern safety management span many types of problems. In practice, each of the following six basic decision problems in safety management will have to be broken down into several subdecisions which will form the basis for choices on each of the main problem areas.
- What is an acceptable safety level or standard of the activity/department/company, etc.?
- What criteria shall be used to assess the safety level?
- What is the current safety level?
- What are the causes of identified deviations between acceptable and observed level of safety?
- What means should be chosen to correct the deviations and keep up the safety level?
- How should corrective actions be implemented and followed up?
Rational Choice Theory
Managers’ methods for making decisions must be based on some principle of rationality in order to gain acceptance among members of the organization. In practical situations what is rational may not always be easy to define, and the logical requirements of what may be defined as rational decisions may be difficult to fulfil. Rational choice theory (RCT), the conception of rational decision making, was originally developed to explain economic behaviour in the marketplace, and later generalized to explain not only economic behaviour but also the behaviour studied by nearly all social science disciplines, from political philosophy to psychology.
The psychological study of optimal human decision making is called subjective expected utility theory (SEU). RCT and SEU are basically the same; only the applications differ. SEU focuses on the thinking of individual decision making, while RCT has a wider application in explaining behaviour within whole organizations or institutions—see, for example, Neumann and Politser (1992). Most of the tools of modern operations research use the assumptions of SEU. They assume that what is desired is to maximize the achievement of some goal, under specific constraints, and assuming that all alternatives and consequences (or their probability distribution) are known (Simon and associates 1992). The essence of RCT and SEU can be summarized as follows (March and Simon 1993):
Decision makers, when encountering a decision-making situation, acquire and see the whole set of alternatives from which they will choose their action. This set is simply given; the theory does not tell how it is obtained.
To each alternative is attached a set of consequences—the events that will ensue if that particular alternative is chosen. Here the existing theories fall into three categories:
- Certainty theories assume the decision maker has complete and accurate knowledge of the consequences that will follow on each alternative. In the case of certainty, the choice is unambiguous.
- Risk theories assume accurate knowledge of a probability distribution of the consequences of each alternative. In the case of risk, rationality is usually defined as the choice of that alternative for which expected utility is greatest.
- Uncertainty theories assume that the consequences of each alternative belong to some subset of all possible consequences, but that the decision maker cannot assign definite probabilities to the occurrence of particular consequences. In the case of uncertainty, the definition of rationality becomes problematic.
At the outset, the decision maker makes use of a “utility function” or a “preference ordering” that ranks all sets of consequences from the most preferred to the least preferred. It should be noted that another proposal is the rule of “minimax risk”, by which one considers the “worst set of consequences” that may follow from each alternative, then selects the alternative whose worst set of consequences is preferred to the worst sets attached to other alternatives.
The decision maker elects the alternative closest to the preferred set of consequences.
One difficulty of RCT is that the term rationality is in itself problematic. What is rational depends upon the social context in which the decision takes place. As pointed out by Flanagan (1991), it is important to distinguish between the two terms rationality and logicality. Rationality is tied up with issues related to the meaning and quality of life for some individual or individuals, while logicality is not. The problem of the benefactor is precisely the issue which rational choice models fail to clarify, in that they assume value neutrality, which is seldom present in real-life decision making (Zey 1992). Although the value of RCT and SEU as explanatory theory is somewhat limited, it has been useful as a theoretical model for “rational” decision making. Evidence that behaviour often deviates from outcomes predicted by expected utility theory does not necessarily mean that the theory inappropriately prescribes how people should make decisions. As a normative model the theory has proven useful in generating research concerning how and why people make decisions which violate the optimal utility axiom.
Applying the ideas of RCT and SEU to safety decision making may provide a basis for evaluating the “rationality” of choices made with respect to safety—for instance, in the selection of preventive measures given a safety problem one wants to alleviate. Quite often it will not be possible to comply with the principles of rational choice because of lack of reliable data. Either one may not have a complete picture of available or possible actions, or else the uncertainty of the effects of different actions, for instance, implementation of different preventive measures, may be large. Thus, RCT may be helpful in pointing out some weaknesses in a decision process, but it provides little guidance in improving the quality of choices to be made. Another limitation in the applicability of rational choice models is that most decisions in organizations do not necessarily search for optimal solutions.
Problem Solving
Rational choice models describe the process of evaluating and choosing between alternatives. However, deciding on a course of action also requires what Simon and associates (1992) describe as problem solving. This is the work of choosing issues that require attention, setting goals, and finding or deciding on suitable courses of action. (While managers may know they have problems, they may not understand the situation well enough to direct their attention to any plausible course of action.) As mentioned earlier, the theory of rational choice has its roots mainly in economics, statistics and operations research, and only recently has it received attention from psychologists. The theory and methods of problem solving has a very different history. Problem solving was initially studied principally by psychologists, and more recently by researchers in artificial intelligence.
Empirical research has shown that the process of problem solving takes place more or less in the same way for a wide range of activities. First, problem solving generally proceeds by selective search through large sets of possibilities, using rules of thumb (heuristics) to guide the search. Because the possibilities in realistic problem situations are virtually endless, a trial-and-error search would simply not work. The search must be highly selective. One of the procedures often used to guide the search is described as hill climbing—using some measure of approach to the goal to determine where it is most profitable to look next. Another and more powerful common procedure is means-ends analysis. When using this method, the problem solver compares the present situation with the goal, detects differences between them, and then searches memory for actions that are likely to reduce the difference. Another thing that has been learned about problem solving, especially when the solver is an expert, is that the solver’s thought process relies on large amounts of information that is stored in memory and that is retrievable whenever the solver recognizes cues signalling its relevance.
One of the accomplishments of contemporary problem-solving theory has been to provide an explanation for the phenomena of intuition and judgement frequently seen in experts’ behaviour. The store of expert knowledge seems to be in some way indexed by the recognition cues that make it accessible. Combined with some basic inferential capabilities (perhaps in the form of means-ends analysis), this indexing function is applied by the expert to find satisfactory solutions to difficult problems.
Most of the challenges which managers of safety face will be of a kind that require some kind of problem solving—for example, detecting what the underlying causes of an accident or a safety problem really are, in order to figure out some preventive measure. The problem-solving cycle developed by Hale et al. (1994)—see figure 1—gives a good description of what is involved in the stages of safety problem solving. What seems evident is that at present it is not possible and may not even be desirable to develop a strictly logical or mathematical model for what is an ideal problem-solving process in the same manner as has been followed for rational choice theories. This view is supported by the knowledge of other difficulties in the real-life instances of problem solving and decision making which are discussed below.
Ill-Structured Problems, Agenda Setting and Framing
In real life, situations frequently occur when the problem-solving process becomes obscure because the goals themselves are complex and sometimes ill-defined. What often happens is that the very nature of the problem is successively transformed in the course of exploration. To the extent that the problem has these characteristics, it may be called ill-structured. Typical examples of problem-solving processes with such characteristics are (1) the development of new designs and (2) scientific discovery.
The solving of ill-defined problems has only recently become a subject of scientific study. When problems are ill-defined, the problem-solving process requires substantial knowledge about solution criteria as well as knowledge about the means for satisfying those criteria. Both kinds of knowledge must be evoked in the course of the process, and the evocation of the criteria and constraint continually modifies and remoulds the solution which the problem-solving process is addressing. Some research concerning problem structuring and analysis within risk and safety issues has been published, and may be profitably studied; see, for example, Rosenhead 1989 and Chicken and Haynes 1989.
Setting the agenda, which is the very first step of the problem-solving process, is also the least understood. What brings a problem to the head of the agenda is the identification of a problem and the consequent challenge to determine how it can be represented in a way that facilitates its solution; these are subjects that only recently have been focused upon in studies of decision processes. The task of setting an agenda is of utmost importance because both individual human beings and human institutions have limited capacities in dealing with many tasks simultaneously. While some problems are receiving full attention, others are neglected. When new problems emerge suddenly and unexpectedly (e.g., firefighting), they may replace orderly planning and deliberation.
The way in which problems are represented has much to do with the quality of the solutions that are found. At present the representation or framing of problems is even less well understood than agenda setting. A characteristic of many advances in science and technology is that a change in framing will bring about a whole new approach to solving a problem. One example of such change in the framing of problem definition in safety science in recent years, is the shift of focus away from the details of the work operations to the organizational decisions and conditions which create the whole work situation—see, for example, Wagenaar et al. (1994).
Decision Making in Organizations
Models of organizational decision making view the question of choice as a logical process in which decision makers try to maximize their objectives in an orderly series of steps (figure 2). This process is in principle the same for safety as for decisions on other issues that the organization has to manage.
Figure 2. The decision-making process in organizations
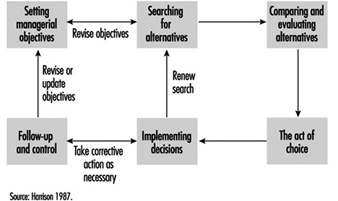
These models may serve as a general framework for “rational decision making” in organizations; however, such ideal models have several limitations and they leave out important aspects of processes which actually may take place. Some of the significant characteristics of organizational decision-making processes are discussed below.
Criteria applied in organizational choice
While rational choice models are preoccupied with finding the optimal alternative, other criteria may be even more relevant in organizational decisions. As observed by March and Simon (1993), organizations for various reasons search for satisfactory rather than optimal solutions.
- Optimal alternatives. An alternative can be defined as optimal if (1) there exists a set of criteria that permits all alternatives to be compared and (2) the alternative in question is preferred, by these criteria, to all other alternatives (see also the discussion of rational choice, above).
- Satisfactory alternatives. An alternative is satisfactory if (1) there exists a set of criteria that describes minimally satisfactory alternatives and (2) the alternative in question meets or exceeds these criteria.
According to March and Simon (1993) most human decision making, whether individual or organizational, is concerned with the discovery and selection of satisfactory alternatives. Only in exceptional cases is it concerned with discovery and selection of optimal alternatives. In safety management, satisfactory alternatives with respect to safety will usually suffice, so that a given solution to a safety problem must meet specified standards. The typical constraints which often apply to optimal choice safety decisions are economic considerations such as: “Good enough, but as cheap as possible”.
Programmed decision making
Exploring the parallels between human decision making and organizational decision making, March and Simon (1993) argued that organizations can never be perfectly rational, because their members have limited information-processing capabilities. It is claimed that decision makers at best can achieve only limited forms of rationality because they (1) usually have to act on the basis of incomplete information, (2) are able to explore only a limited number of alternatives relating to any given decision, and (3) are unable to attach accurate values to outcomes. March and Simon maintain that the limits on human rationality are institutionalized in the structure and modes of functioning of our organizations. In order to make the decision-making process manageable, organizations fragment, routinize and limit the decision process in several ways. Departments and work units have the effect of segmenting the organization’s environment, of compartmentalizing responsibilities, and thus of simplifying the domains of interest and decision making of managers, supervisors and workers. Organizational hierarchies perform a similar function, providing channels of problem solving in order to make life more manageable. This creates a structure of attention, interpretation and operation that exerts a crucial influence on what is appreciated as “rational” choices of the individual decision maker in the organizational context. March and Simon named these organized sets of responses performance programmes, or simply programmes. The term programme is not intended to connote complete rigidity. The content of the programme may be adaptive to a large number of characteristics that initiate it. The programme may also be conditional on data that are independent of the initiating stimuli. It is then more properly called a performance strategy.
A set of activities is regarded as routinized to the degree that choice has been simplified by the development of fixed response to defined stimuli. If searches have been eliminated, but choice remains in the form of clearly defined systematic computing routines, the activity is designated as routinized. Activities are regarded as unroutinized to the extent that they have to be preceded by programme-developing activities of a problem-solving kind. The distinction made by Hale et al. (1994) (discussed above) between the levels of execution, planning and system structure/management carry similar implications concerning the structuring of the decision-making process.
Programming influences decision making in two ways: (1) by defining how a decision process should be run, who should participate, and so on, and (2) by prescribing choices to be made based on the information and alternatives at hand. The effects of programming are on the one hand positive in the sense that they may increase the efficiency of the decision process and assure that problems are not left unresolved, but are treated in a way that is well structured. On the other hand, rigid programming may hamper the flexibility that is needed especially in the problem-solving phase of a decision process in order to generate new solutions. For example, many airlines have established fixed procedures for treatment of reported deviations, so-called flight reports or maintenance reports, which require that each case be examined by an appointed person and that a decision be made concerning preventive actions to be taken based on the incident. Sometimes the decision may be that no action shall be taken, but the procedures assure that such a decision is deliberate, and not a result of negligence, and that there is a responsible decision maker involved in the decisions.
The degree to which activities are programmed influences risk taking. Wagenaar (1990) maintained that most accidents are consequences of routine behaviour without any consideration of risk. The real problem of risk occurs at higher levels in organizations, where the unprogrammed decisions are made. But risks are most often not taken consciously. They tend to be results of decisions made on issues which are not directly related to safety, but where preconditions for safe operation were inadvertently affected. Managers and other high-level decision makers are thus more often permitting opportunities for risks than taking risks.
Decision Making, Power and Conflict of Interests
The ability to influence the outcomes of decision-making processes is a well-recognized source of power, and one that has attracted considerable attention in organization-theory literature. Since organizations are in large measure decision-making systems, an individual or group can exert major influence on the decision processes of the organization. According to Morgan (1986) the kinds of power used in decision making can be classified into the following three interrelated elements:
- The decision premises. Influence on the decision premises may be exerted in several ways. One of the most effective ways of “making” a decision is to allow it to be made by default. Hence much of the political activity within an organization depends on the control of agendas and other decision premises that influence how particular decisions will be approached, perhaps in ways that prevent certain core issues from surfacing at all. In addition, decision premises are manipulated by the unobtrusive control embedded in choice of those vocabularies, structures of communications, attitudes, beliefs, rules and procedures which are accepted without questioning. These factors shape decisions by the way we think and act. According to Morgan (1986), visions of what the problems and issues are and how they can be tackled, often act as mental straitjackets that prevent us from seeing other ways of formulating our basic concerns and the alternative courses of action that are available.
- The decision processes. Control of decision processes is usually more visible than the control of decision premises. How to treat an issue involves questions such as who should be involved, when the decision should be made, how the issue should be handled at meetings, and how it should be reported. The ground rules that are to guide decision making are important variables that organization members can manipulate in order to influence the outcome.
- The decision issues and objectives. A final way of controlling decision making is to influence the issues and objectives to be addressed and the evaluative criteria to be employed. An individual can shape the issues and objectives most directly through preparing reports and contributing to the discussion on which the decision will be based. By emphasizing the importance of particular constraints, selecting and evaluating the alternatives on which a decision will be made, and highlighting the importance of certain values or outcomes, decision makers can exert considerable influence on the decision that emerges from discussion.
Some decision problems may carry a conflict of interest—for example, between management and employees. Disagreement may occur on the definition of what is really the problem—what Rittel and Webber (1973) characterized as “wicked” problems, to be distinguished from problems that are “tame” with respect to securing consent. In other cases, parties may agree on problem definition but not on how the problem should be solved, or what are acceptable solutions or criteria for solutions. The attitudes or strategies of conflicting parties will define not only their problem-solving behaviour, but also the prospects of reaching an acceptable solution through negotiations. Important variables are how parties attempt to satisfy their own versus the other party’s concerns (figure 3). Successful collaboration requires that both parties are assertive concerning their own needs, but are simultaneously willing to take the needs of the other party equally into consideration.
Figure 3. Five styles of negotiating behaviour
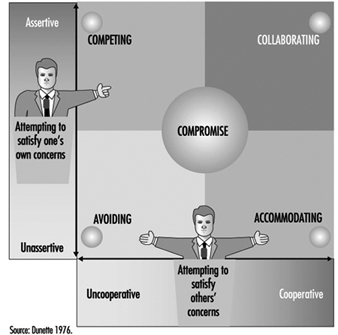
Another interesting typology based on the amount of agreement between goals and means, was developed by Thompson and Tuden (1959) (cited in Koopman and Pool 1991). The authors suggested what was a “best-fitting strategy” based on knowledge about the parties’ perceptions of the causation of the problem and about preferences of outcomes (figure 4).
Figure 4. A typology of problem-solving strategy
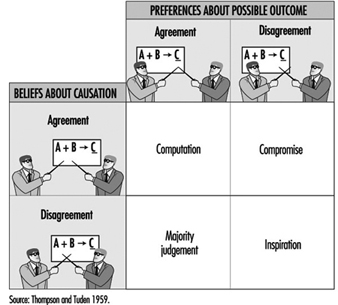
If there is agreement on goals and means, the decision can be calculated—for example, developed by some experts. If the means to the desired ends are unclear, these experts will have to reach a solution through consultation (majority judgement). If there is any conflict about the goals, consultation between the parties involved is necessary. However, if agreement is lacking both on goals and means, the organization is really endangered. Such a situation requires charismatic leadership which can “inspire” a solution acceptable to the conflicting parties.
Decision making within an organizational framework thus opens up perspectives far beyond those of rational choice or individual problem-solving models. Decision processes must be seen within the framework of organizational and management processes, where the concept of rationality may take on new and different meanings from those defined by the logicality of rational choice approaches embedded in, for example, operations research models. Decision making carried out within safety management must be regarded in light of such a perspective as will allow a full understanding of all aspects of the decision problems at hand.
Summary and Conclusions
Decision making can generally be described as a process starting with an initial situation (initial state) which decision makers perceive to be deviating from a desired goal situation (goal state), although they do not know in advance how to alter the initial state into the goal state (Huber 1989). The problem solver transforms the initial state into the goal state by applying one or more operators, or activities to alter states. Often a sequence of operators is required to bring about the desired change.
The research literature on the subject provides no simple answers to how to make decisions on safety issues; therefore, the methods of decision making must be rational and logical. Rational choice theory represents an elegant conception of how optimal decisions are made. However, within safety management, rational choice theory cannot be easily applied. The most obvious limitation is the lack of valid and reliable data on potential choices with respect to both completeness and to knowledge of consequences. Another difficulty is that the concept rational assumes a benefactor, which may differ depending on which perspective is chosen in a decision situation. However, the rational choice approach may still be helpful in pointing out some of the difficulties and shortcomings of the decisions to be made.
Often the challenge is not to make a wise choice between alternative actions, but rather to analyse a situation in order to find out what the problem really is. In analysing safety management problems, structuring is often the most important task. Understanding the problem is a prerequisite for finding an acceptable solution. The most important issue concerning problem solving is not to identify a single superior method, which probably does not exist on account of the wide range of problems within the areas of risk assessment and safety management. The main point is rather to take a structured approach and document the analysis and decisions made in such a way that the procedures and evaluations are traceable.
Organizations will manage some of their decision making through programmed actions. Programming or fixed procedures for decision-making routines may be very useful in safety management. An example is how some companies treat reported deviations and near accidents. Programming can be an efficient way to control decision-making processes in the organization, provided that the safety issues and decision rules are clear.
In real life, decisions take place within an organizational and social context where conflicts of interest sometimes emerge. The decision processes may be hindered by different perceptions of what the problems are, of criteria, or of the acceptability of proposed solutions. Being aware of the presence and possible effects of vested interests is helpful in making decisions which are acceptable to all parties involved. Safety management includes a large variety of problems depending on which life cycle, organizational level and stage of problem solving or hazard alleviation a problem concerns. In that sense, decision making concerning safety is as wide in scope and character as decision making on any other management issues.
Risk Perception
In risk perception, two psychological processes may be distinguished: hazard perception and risk assessment. Saari (1976) defines the information processed during the accomplishment of a task in terms of the following two components: (1) the information required to execute a task (hazard perception) and (2) the information required to keep existing risks under control (risk assessment). For instance, when construction workers on the top of ladders who are drilling holes in a wall have to simultaneously keep their balance and automatically coordinate their body-hand movements, hazard perception is crucial to coordinate body movement to keep dangers under control, whereas conscious risk assessment plays only a minor role, if any. Human activities generally seem to be driven by automatic recognition of signals which trigger a flexible, yet stored hierarchy of action schemata. (The more deliberate process leading to the acceptance or rejection of risk is discussed in another article.)
Risk Perception
From a technical point of view, a hazard represents a source of energy with the potential of causing immediate injury to personnel and damage to equipment, environment or structure. Workers may also be exposed to diverse toxic substances, such as chemicals, gases or radioactivity, some of which cause health problems. Unlike hazardous energies, which have an immediate effect on the body, toxic substances have quite different temporal characteristics, ranging from immediate effects to delays over months and years. Often there is an accumulating effect of small doses of toxic substances which are imperceptible to the exposed workers.
Conversely, there may be no harm to persons from hazardous energy or toxic substances provided that no danger exists. Danger expresses the relative exposure to hazard. In fact there may be little danger in the presence of some hazards as a result of the provision of adequate precautions. There is voluminous literature pertaining to factors people use in the final assessment of whether a situation is determined hazardous, and, if so, how hazardous. This has become known as risk perception. (The word risk is being used in the same sense that danger is used in occupational safety literature; see Hoyos and Zimolong 1988.)
Risk perception deals with the understanding of perceptual realities and indicators of hazards and toxic substances—that is, the perception of objects, sounds, odorous or tactile sensations. Fire, heights, moving objects, loud noise and acid smells are some examples of the more obvious hazards which do not need to be interpreted. In some instances, people are similarly reactive in their responses to the sudden presence of imminent danger. The sudden occurrence of loud noise, loss of balance, and objects rapidly increasing in size (and so appearing about to strike one’s body), are fear stimuli, prompting automatic responses such as jumping, dodging, blinking and clutching. Other reflex reactions include rapidly withdrawing a hand which has touched a hot surface. Rachman (1974) concludes that the prepotent fear stimuli are those which have the attributes of novelty, abruptness and high intensity.
Probably most hazards and toxic substances are not directly perceptible to the human senses, but are inferred from indicators. Examples are electricity; colourless, odourless gases such as methane and carbon monoxide; x rays and radioactive subs-tances; and oxygen-deficient atmospheres. Their presence must be signalled by devices which translate the presence of the hazard into something which is recognizable. Electrical currents can be perceived with the help of a current checking device, such as may be used for signals on the gauges and meters in a control-room register that indicate normal and abnormal levels of temperature and pressure at a particular state of a chemical process. There are also situations where hazards exist which are not perceivable at all or cannot be made perceivable at a given time. One example is the danger of infection when one opens blood probes for medical tests. The knowledge that hazards exist must be deduced from one’s knowledge of the common principles of causality or acquired by experience.
Risk Assessment
The next step in information-processing is risk assessment, which refers to the decision process as it is applied to such issues as whether and to what extent a person will be exposed to danger. Consider, for instance, driving a car at high speed. From the perspective of the individual, such decisions have to be made only in unexpected circumstances such as emergencies. Most of the required driving behaviour is automatic and runs smoothly without continuous attentional control and conscious risk assessment.
Hacker (1987) and Rasmussen (1983) distinguished three levels of behaviour: (1) skill-based behaviour, which is almost entirely automatic; (2) rule-based behaviour, which operates through the application of consciously chosen but fully pre-programmed rules; and (3) knowledge-based behaviour, under which all sorts of conscious planning and problem solving are grouped. At the skill-based level, an incoming piece of information is connected directly to a stored response that is executed automatically and carried out without conscious deliberation or control. If there is no automatic response available or any extraordinary event occurring, the risk assessment process moves to the rule-based level, where the appropriate action is selected from a sample of procedures taken out of storage and then executed. Each of the steps involves a finely tuned perceptual-motor programme, and usually, no step in this organizational hierarchy involves any decisions based on risk considerations. Only at the transitions is a conditional check applied, just to verify whether the progress is according to plan. If not, automatic control is halted and the ensuing problem solved at a higher level.
Reason’s GEMS (1990) model describes how the transition from automatic control to conscious problem solving takes place when exceptional circumstances arise or novel situations are encountered. Risk assessment is absent at the bottom level, but may be fully present at the top level. At the middle level one can assume some sort of “quick-and-dirty” risk assessment, while Rasmussen excludes any type of assessment that is not incorporated in fixed rules. Much of the time there will be no conscious perception or consideration of hazards as such. “The lack of safety consciousness is both a normal and a healthy state of affairs, despite what has been said in countless books, articles and speeches. Being constantly conscious of danger is a reasonable definition of paranoia” (Hale and Glendon 1987). People doing their jobs on a routine basis rarely consider these hazards or accidents in advance: they run risks, but they do not take them.
Hazard Perception
Perception of hazards and toxic substances, in the sense of direct perception of shape and colour, loudness and pitch, odours and vibrations, is restricted by the capacity limitations of the perceptual senses, which can be temporarily impaired due to fatigue, illness, alcohol or drugs. Factors such as glare, brightness or fog can put heavy stress on perception, and dangers can fail to be detected because of distractions or insufficient alertness.
As has already been mentioned, not all hazards are directly perceptible to the human senses. Most toxic substances are not even visible. Ruppert (1987) found in his investigation of an iron and steel factory, of municipal garbage collecting and of medical laboratories, that from 2,230 hazard indicators named by 138 workers, only 42% were perceptible by the human senses. Twenty-two per cent of the indicators have to be inferred from comparisons with standards (e.g., noise levels). Hazard perception is based in 23% of cases on clearly perceptible events which have to be interpreted with respect to knowledge about hazardousness (e.g., a glossy surface of a wet floor indicates slippery). In 13% of reports, hazard indicators can be retrieved only from memory of proper steps to be taken (e.g., current in a wall socket can be made perceivable only by the proper checking device). These results demonstrate that the requirements of hazard perception range from pure detection and perception to elaborate cognitive inference processes of anticipation and assessment. Cause-and-effect relationships are sometimes unclear, scarcely detectable, or misinterpreted, and delayed or accumulating effects of hazards and toxic substances are likely to impose additional burdens on individuals.
Hoyos et al. (1991) have listed a comprehensive picture of hazard indicators, behavioural requirements and safety-relevant conditions in industry and public services. A Safety Diagnosis Questionnaire (SDQ) has been developed to provide a practical instrument to analyse hazards and dangers through observation (Hoyos and Ruppert 1993). More than 390 workplaces, and working and environmental conditions in 69 companies concerned with agriculture, industry, manual work and the service industries, have been assessed. Because the companies had accident rates greater than 30 accidents per 1,000 employees with a minimum of 3 lost working days per accident, there appears to be a bias in these studies towards dangerous worksites. Altogether 2,373 hazards have been reported by the observers using SDQ, indicating a detection rate of 6.1 hazards per workplace and between 7 and 18 hazards have been detected at approximately 40% of all workplaces surveyed. The surprisingly low mean rate of 6.1 hazards per workplace has to be interpreted with consideration toward the safety measures broadly introduced in industry and agriculture during the last 20 years. Hazards reported do not include those attributable to toxic substances, nor hazards controlled by technical safety devices and measures, and thus reflect the distribution of “residual hazards”.
In figure 1 an overview of requirements for perceptual processes of hazard detection and perception is presented. Observers had to assess all hazards at a particular workplace with respect to 13 requirements, as indicated in the figure. On the average, 5 requirements per hazard were identified, including visual recognition, selective attention, auditory recognition and vigilance. As expected, visual recognition dominates by comparison with auditory recognition (77.3% of the hazards were detected visually and only 21.2% by auditory detection). In 57% of all hazards observed, workers had to divide their attention between tasks and hazard control, and divided attention is a very strenuous mental achievement likely to contribute to errors. Accidents have frequently been traced back to failures in attention while performing dual tasks. Even more alarming is the finding that in 56% of all hazards, workers had to cope with rapid activities and responsiveness to avoid being hit and injured. Only 15.9% and 7.3% of all hazards were indicated by acoustical or optical warnings, respectively: consequently, hazard detection and perception was self-initiated.
Figure 1. Detection and perception of hazard indicators in industry
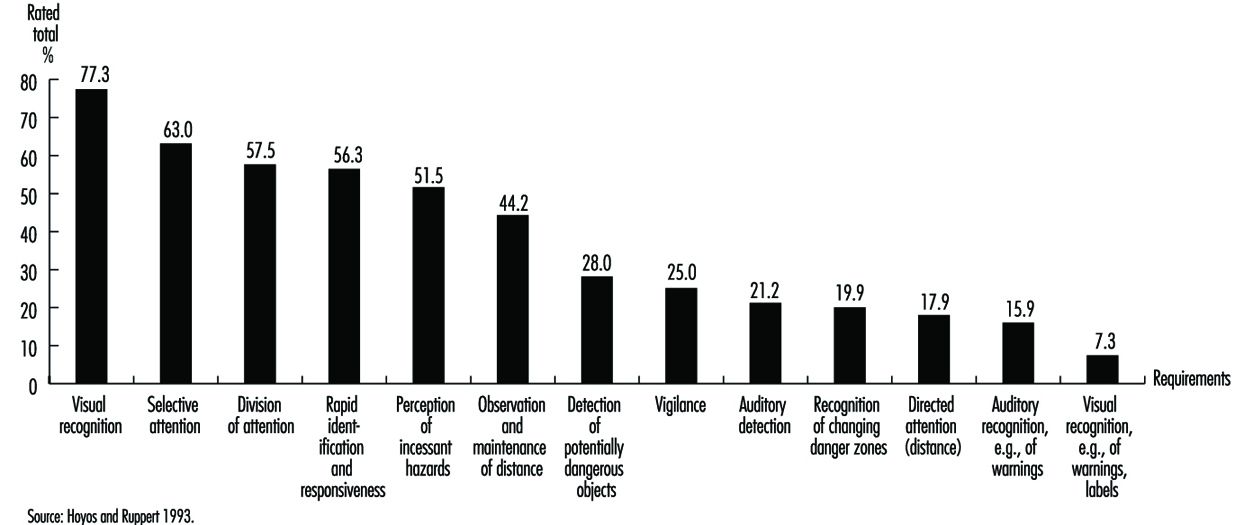
In some cases (16.1%) perception of hazards is supported by signs and warnings, but usually, workers rely on knowledge, training and work experience. Figure 2 shows the requirements of anticipation and assessment required to control hazards at the worksite. The core characteristic of all activities summarized in this figure is the need for knowledge and experience gained in the work process, including: technical knowledge about weight, forces and energies; training to identify defects and inadequacies of work tools and machinery; and experience to predict structural weaknesses of equipment, buildings and material. As Hoyos et al. (1991) have demonstrated, workers have little knowledge relating to hazards, safety rules and proper personal preventive behaviour. Only 60% of the construction workers and 61% of the auto-mechanics questioned knew the right solutions to the safety-related problems generally encountered at their workplaces.
Figure 2. Anticipation and assessment of hazard indicators
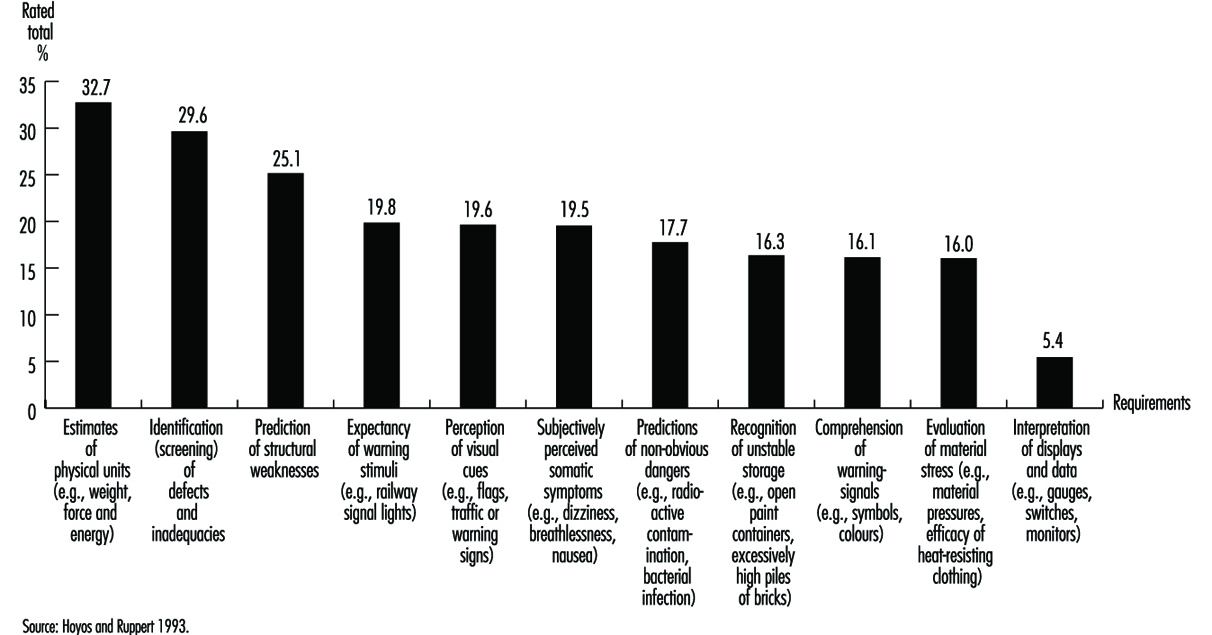
The analysis of hazard perception indicates that different cognitive processes are involved, such as visual recognition; selective and divided attention; rapid identification and responsiveness; estimates of technical parameters; and predictions of non-observable hazards and dangers. In fact, hazards and dangers are frequently unknown to job incumbents: they impose a heavy burden on people who have to cope sequentially with dozens of visual- and auditory-based requirements and are a source of proneness to error when work and hazard control is performed simultaneously. This requires much more emphasis to be placed on regular analysis and identification of hazards and dangers at the workplace. In several countries, formal risk assessments of workplaces are mandatory: for example, the health and safety Directives of the EEC require risk assessment of computer workplaces prior to commencing work in them, or when major alterations at work have been introduced; and the US Occupational Safety and Health Administration (OSHA) requires regular hazard risk analyses of process units.
Coordination of Work and Hazard Control
As Hoyos and Ruppert (1993) point out, (1) work and hazard control may require attention simultaneously; (2) they may be managed alternatively in sequential steps; or (3) prior to the commencement of work, precautionary measures may be taken (e.g., putting on a safety helmet).
In the case of simultaneously occurring requirements, hazard control is based on visual, auditory and tactile recognition. In fact, it is difficult to separate work and hazard control in routine tasks. For example, a source of constant danger is present when performing the task of cutting off threads from yarns in a cotton-mill factory—a task requiring a sharp knife. The only two types of protection against cuts are skill in wielding the knife and use of protective equipment. If either or both are to succeed, they must be totally incorporated into the worker’s action sequences. Habits such as cutting in a direction away from the hand which is holding the thread must be ingrained into the worker’s skills from the outset. In this example hazard control is fully integrated into task control; no separate process of hazard detection is required. Probably there is a continuum of integration into work, the degree depending on the skill of the worker and the requirements of the task. On the one hand, hazard perception and control is inherently integrated into work skills; on the other hand, task execution and hazard control are distinctly separate activities. Work and hazard control may be carried out alternatively, in sequential steps, when during the task, danger potential steadily increases or there is an abrupt, alerting danger signal. As a consequence, workers interrupt the task or process and take preventive measures. For example, the checking of a gauge is a typical example of a simple diagnostic test. A control room operator detects a deviation from standard level on a gauge which at first glance does not constitute a dramatic sign of danger, but which prompts the operator to search further on other gauges and meters. If there are other deviations present, a rapid series of scanning activities will be carried out at the rule-based level. If deviations on other meters do not fit into a familiar pattern, the diagnosis process shifts to the knowledge-based level. In most cases, guided by some strategies, signals and symptoms are actively looked for to locate causes of the deviations (Konradt 1994). The allocation of resources of the attentional control system is set to general monitoring. A sudden signal, such as a warning tone or, as in the case above, various deviations of pointers from a standard, shifts the attentional control system onto the specific topic of hazard control. It initiates an activity which seeks to identify the causes of the deviations on the rule-based level, or in case of misfortune, on the knowledge-based level (Reason 1990).
Preventive behaviour is the third type of coordination. It occurs prior to work, and the most prominent example is the use of personal protective equipment (PPE).
The Meanings of Risk
Definitions of risks and methods to assess risks in industry and society have been developed in economics, engineering, chemistry, safety sciences and ergonomics (Hoyos and Zimolong 1988). There is a wide variety of interpretations of the term risk. On the one hand, it is interpreted to mean “probability of an undesired event”. It is an expression of the likelihood that something unpleasant will happen. A more neutral definition of risk is used by Yates (1992a), who argues that risk should be perceived as a multidimensional concept that as a whole refers to the prospect of loss. Important contributions to our current understanding of risk assessment in society have come from geography, sociology, political science, anthropology and psychology. Research focused originally on understanding human behaviour in the face of natural hazards, but it has since broadened to incorporate technological hazards as well. Sociological research and anthropological studies have shown that assessment and acceptance of risks have their roots in social and cultural factors. Short (1984) argues that responses to hazards are mediated by social influences transmitted by friends, family, co-workers and respected public officials. Psychological research on risk assessment originated in empirical studies of probability assessment, utility assessment and decision-making processes (Edwards 1961).
Technical risk assessment usually focuses on the potential for loss, which includes the probability of the loss’s occurring and the magnitude of the given loss in terms of death, injury or damages. Risk is the probability that damage of a specified type will occur in a given system over a defined time period. Different assessment techniques are applied to meet the various requirements of industry and society. Formal analysis methods to estimate degrees of risk are derived from different kinds of fault tree analyses; by use of data banks comprising error probabilities such as THERP (Swain and Guttmann 1983); or on decomposition methods based on subjective ratings such as SLIM-Maud (Embrey et al. 1984). These techniques differ considerably in their potential to predict future events such as mishaps, errors or accidents. In terms of error prediction in industrial systems, experts attained the best results with THERP. In a simulation study, Zimolong (1992) found a close match between objectively derived error probabilities and their estimates derived with THERP. Zimolong and Trimpop (1994) argued that such formal analyses have the highest “objectivity” if conducted properly, as they separated facts from beliefs and took many of the judgemental biases into account.
The public’s sense of risk depends on more than the probability and magnitude of loss. It may depend on factors such as potential degree of damage, unfamiliarity with possible consequences, the involuntary nature of exposure to risk, the uncontrollability of damage, and possible biased media coverage. The feeling of control in a situation may be a particularly important factor. For many, flying seems very unsafe because one has no control over one’s fate once in the air. Rumar (1988) found that the perceived risk in driving a car is typically low, since in most situations the drivers believe in their own ability to achieve control and are accustomed to the risk. Other research has addressed emotional reactions to risky situations. The potential for serious loss generates a variety of emotional reactions, not all of which are necessarily unpleasant. There is a fine line between fear and excitement. Again, a major determinant of perceived risk and of affective reactions to risky situations seems to be a person’s feeling of control or lack thereof. As a consequence, for many people, risk may be nothing more than a feeling.
Decision Making under Risk
Risk taking may be the result of a deliberate decision process entailing several activities: identification of possible courses of action; identification of consequences; evaluation of the attractiveness and chances of the consequences; or deciding according to a combination of all the previous assessments. The overwhelming evidence that people often make poor choices in risky situations implies the potential to make better decisions. In 1738, Bernoulli defined the notion of a “best bet” as one which maximizes the expected utility (EU) of the decision. The EU concept of rationality asserts that people ought to make decisions by evaluating uncertainties and considering their choices, the possible consequences, and one’s preferences for them (von Neumann and Morgenstern 1947). Savage (1954) later generalized the theory to allow probability values to represent subjective or personal probabilities.
Subjective expected utility (SEU) is a normative theory which describes how people should proceed when making decisions. Slovic, Kunreuther and White (1974) stated, “Maximization of expected utility commands respect as a guideline for wise behaviour because it is deduced from axiomatic principles that presumably would be accepted by any rational man.” A good deal of debate and empirical research has centred around the question of whether this theory could also describe both the goals that motivate actual decision makers and the processes they employ when reaching their decisions. Simon (1959) criticized it as a theory of a person selecting among fixed and known alternatives, to each of which known consequences are attached. Some researchers have even questioned whether people should obey the principles of expected utility theory, and after decades of research, SEU applications remain controversial. Research has revealed that psychological factors play an important role in decision making and that many of these factors are not adequately captured by SEU models.
In particular, research on judgement and choice has shown that people have methodological deficiencies such as understanding probabilities, negligence of the effect of sample sizes, reliance on misleading personal experiences, holding judgements of fact with unwarranted confidence, and misjudging risks. People are more likely to underestimate risks if they have been voluntarily exposed to risks over a longer period, such as living in areas subject to floods or earthquakes. Similar results have been reported from industry (Zimolong 1985). Shunters, miners, and forest and construction workers all dramatically underestimate the riskiness of their most common work activities as compared to objective accident statistics; however, they tend to overestimate any obvious dangerous activities of fellow workers when required to rate them.
Unfortunately, experts’ judgements appear to be prone to many of the same biases as those of the public, particularly when experts are forced to go beyond the limits of available data and rely upon their intuitions (Kahneman, Slovic and Tversky 1982). Research further indicates that disagreements about risk should not disappear completely even when sufficient evidence is available. Strong initial views are resistant to change because they influence the way that subsequent information is interpreted. New evidence appears reliable and informative if it is consistent with one’s initial beliefs; contrary evidence tends to be dismissed as unreliable, erroneous or unrepresentative (Nisbett and Ross 1980). When people lack strong prior opinions, the opposite situation prevails—they are at the mercy of the formulation of the problem. Presenting the same information about risk in different ways (e.g., mortality rates as opposed to survival rates) alters their perspectives and their actions (Tversky and Kahneman 1981). The discovery of this set of mental strategies, or heuristics, that people implement in order to structure their world and predict their future courses of action, has led to a deeper understanding of decision making in risky situations. Although these rules are valid in many circumstances, in others they lead to large and persistent biases with serious implications for risk assessment.
Personal Risk Assessment
The most common approach in studying how people make risk assessments uses psychophysical scaling and multivariate analysis techniques to produce quantitative representations of risk attitudes and assessment (Slovic, Fischhoff and Lichtenstein 1980). Numerous studies have shown that risk assessment based on subjective judgements is quantifiable and predictable. They also have shown that the concept of risk means different things to different people. When experts judge risk and rely on personal experience, their responses correlate highly with technical estimates of annual fatalities. Laypeople’s judgements of risk are related more to other characteristics, such as catastrophic potential or threat to future generations; as a result, their estimates of loss probabilities tend to differ from those of experts.
Laypeople’s risk assessments of hazards can be grouped into two factors (Slovic 1987). One of the factors reflects the degree to which a risk is understood by people. Understanding a risk relates to the degree to which it is observable, is known to those exposed, and can be detected immediately. The other factor reflects the degree to which the risk evokes a feeling of dread. Dread is related to the degree of uncontrollability, of serious consequences, of exposure of high risks to future generations, and of involuntary increase of risk. The higher a hazard’s score on the latter factor, the higher its assessed risk, the more people want to see its current risks reduced, and the more they want to see strict regulation employed to achieve the desired reduction in risk. Consequently, many conflicts about risk may result from experts’ and laypeople’s views originating from different definitions of the concept. In such cases, expert citations of risk statistics or of the outcome of technical risk assessments will do little to change people’s attitudes and assessments (Slovic 1993).
The characterization of hazards in terms of “knowledge” and “threat” leads back to the previous discussion of hazard and danger signals in industry in this section, which were discussed in terms of “perceptibility”. Forty-two per cent of the hazard indicators in industry are directly perceptible by human senses, 45% of cases have to be inferred from comparisons with standards, and 3% from memory. Perceptibility, knowledge and the threats and thrills of hazards are dimensions which are closely related to people’s experience of hazards and perceived control; however, to understand and predict individual behaviour in the face of danger we have to gain a deeper understanding of their relationships with personality, requirements of tasks, and societal variables.
Psychometric techniques seem well-suited to identify similarities and differences among groups with regard to both personal habits of risk assessment and to attitudes. However, other psychometric methods such as multidimensional analysis of hazard similarity judgements, applied to quite different sets of hazards, produce different representations. The factor-analytical approach, while informative, by no means provides a universal representation of hazards. Another weakness of psychometric studies is that people face risk only in written statements, and divorce the assessment of risk from behaviour in actual risky situations. Factors that affect a person’s considered assessment of risk in a psychometric experiment may be trivial when confronted with an actual risk. Howarth (1988) suggests that such conscious verbal knowledge usually reflects social stereotypes. By contrast, risk-taking responses in traffic or work situations are controlled by the tacit knowledge that underlies skilled or routine behaviour.
Most of the personal risk decisions in everyday life are not conscious decisions at all. People are, by and large, not even aware of risk. In contrast, the underlying notion of psychometric experiments is presented as a theory of deliberate choice. Assessments of risks usually performed by means of a questionnaire are conducted deliberately in an “armchair” fashion. In many ways, however, a person’s responses to risky situations are more likely to result from learned habits that are automatic, and which are below the general level of awareness. People do not normally evaluate risks, and therefore it cannot be argued that their way of evaluating risk is inaccurate and needs to be improved. Most risk-related activities are necessarily executed at the bottom level of automated behaviour, where there is simply no room for consideration of risks. The notion that risks, identified after the occurrence of accidents, are accepted after a conscious analysis, may have emerged from a confusion between normative SEU and descriptive models (Wagenaar 1992). Less attention was paid to the conditions in which people will act automatically, follow their gut feeling, or accept the first choice that is offered. However, there is a widespread acceptance in society and among health and safety professionals that risk taking is a prime factor in causing mishaps and errors. In a representative sample of Swedes aged between 18 and 70 years, 90% agreed that risk taking is the major source of accidents (Hovden and Larsson 1987).
Preventive Behaviour
Individuals may deliberately take preventive measures to exclude hazards, to attenuate the energy of hazards or to protect themselves by precautionary measures (for instance, by wearing safety glasses and helmets). Often people are required by a company’s directives or even by law to comply with protective measures. For example, a roofer builds a scaffolding prior to working on a roof to prevent the eventuality of suffering a fall. This choice might be the result of a conscious risk assessment process of hazards and of one’s own coping skills, or, more simply, it may be the outcome of a habituation process, or it may be a requirement which is enforced by law. Often warnings are used to indicate mandatory preventive actions.
Several forms of preventive activities in industry have been analysed by Hoyos and Ruppert (1993). Some of them are shown in figure 3, together with their frequency of requirement. As indicated, preventive behaviour is partly self-controlled and partly enforced by the legal standards and requirements of the company. Preventive activities comprise some of the following measures: planning work procedures and steps ahead; use of PPE; application of safety work technique; selection of safe work procedures by means of proper material and tools; setting an appropriate work pace; and inspection of facilities, equipment, machinery and tools.
Figure 3. Typical examples of personal preventive behaviour in industry and frequency of preventive measure
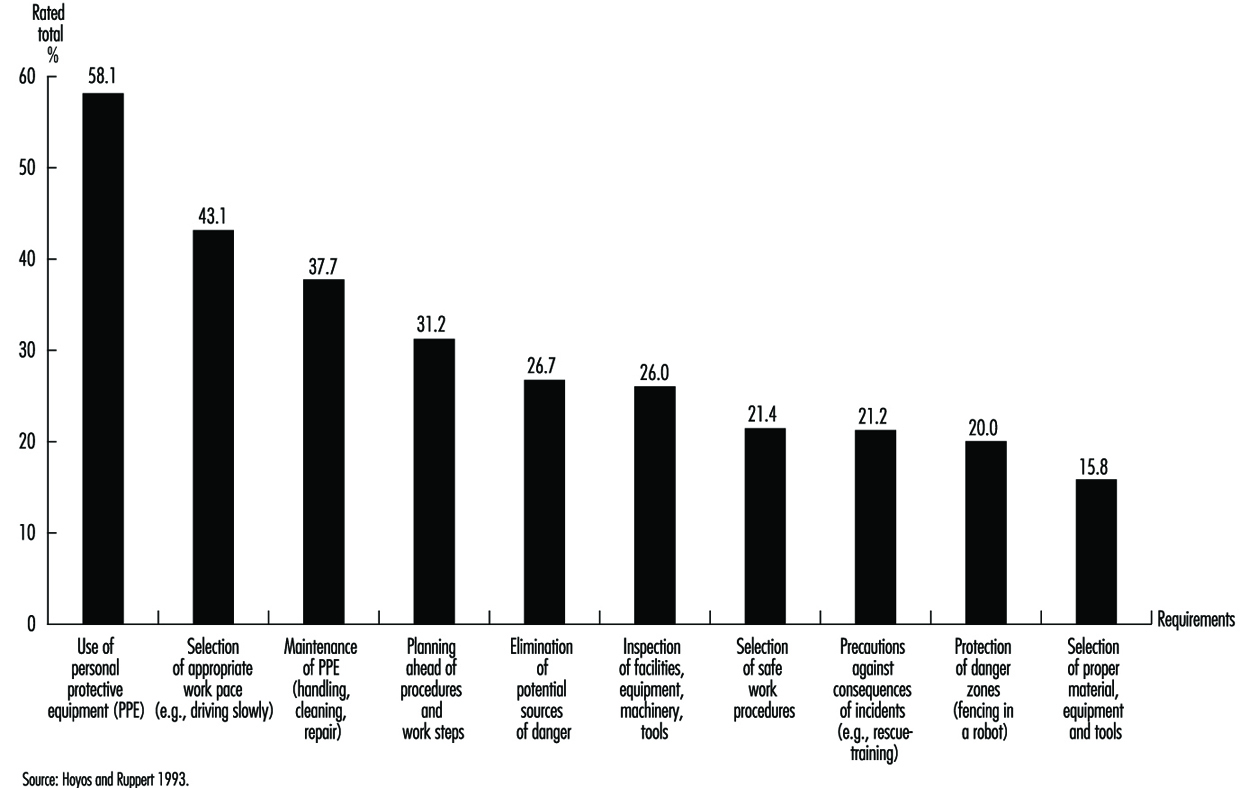
Personal Protective Equipment
The most frequent preventive measure required is the use of PPE. Together with correct handling and maintenance, it is by far the most common requirement in industry. There exist major differences in the usage of PPE between companies. In some of the best companies, mainly in chemical plants and petroleum refineries, the usage of PPE approaches 100%. In contrast, in the construction industry, safety officials have problems even in attempts to introduce particular PPE on a regular basis. It is doubtful that risk perception is the major factor which makes the difference. Some of the companies have successfully enforced the use of PPE which then becomes habitualized (e.g., the wearing of safety helmets) by establishing the “right safety culture” and subsequently altered personal risk assessment. Slovic (1987) in his short discussion on the usage of seat-belts shows that about 20% of road users wear seat-belts voluntarily, 50% would use them only if it were made mandatory by law, and beyond this number, only control and punishment will serve to improve automatic use.
Thus, it is important to understand what factors govern risk perception. However, it is equally important to know how to change behaviour and subsequently how to alter risk perception. It seems that many more precautionary measures need to be undertaken at the level of the organization, among the planners, designers, managers and those authorities that make decisions which have implications for many thousands of people. Up to now, there is little understanding at these levels as to which factors risk perception and assessment depend upon. If companies are seen as open systems, where different levels of organizations mutually influence each other and are in steady exchange with society, a systems approach may reveal those factors which constitute and influence risk perception and assessment.
Warning Labels
The use of labels and warnings to combat potential hazards is a controversial procedure for managing risks. Too often they are seen as a way for manufacturers to avoid responsibility for unreasonably risky products. Obviously, labels will be successful only if the information they contain is read and understood by members of the intended audience. Frantz and Rhoades (1993) found that 40% of clerical personnel filling a file cabinet noticed a warning label placed on the top drawer of the cabinet, 33% read part of it, and no one read the entire label. Contrary to expectation, 20% complied completely by not placing any material in the top drawer first. Obviously it is insufficient to scan the most important elements of the notice. Lehto and Papastavrou (1993) provided a thorough analysis of findings pertaining to warning signs and labels by examining receiver-, task-, product- and message-related factors. Furthermore, they provided a significant contribution to understanding the effectiveness of warnings by considering different levels of behaviour.
The discussion of skilled behaviour suggests that a warning notice will have little impact on the way people perform a familiar task, as it simply will not be read. Lehto and Papastavrou (1993) concluded from research findings that interrupting familiar task performance may effectively increase workers’ noticing warning signs or labels. In the experiment by Frantz and Rhoades (1993), noticing the warning labels on filing cabinets increased to 93% when the top drawer was sealed shut with a warning indicating that a label could be found within the drawer. The authors concluded, however, that ways of interrupting skill-based behaviour are not always available and that their effectiveness after initial use can diminish considerably.
At a rule-based level of performance, warning information should be integrated into the task (Lehto 1992) so that it can be easily mapped to immediate relevant actions. In other words, people should try to get the task executed following the directions of the warning label. Frantz (1992) found that 85% of subjects expressed the need for a requirement on the directions of use of a wood preservative or drain cleaner. On the negative side, studies of comprehension have revealed that people may poorly comprehend the symbols and text used in warning signs and labels. In particular, Koslowski and Zimolong (1992) found that chemical workers understood the meaning of only approximately 60% of the most important warning signs used in the chemical industry.
At a knowledge-based level of behaviour, people seem likely to notice warnings when they are actively looking for them. They expect to find warnings close to the product. Frantz (1992) found that subjects in unfamiliar settings complied with instructions 73% of the time if they read them, compared to only 9% when they did not read them. Once read, the label must be understood and recalled. Several studies of comprehension and memory also imply that people may have trouble remembering the information they read from either instruction or warning labels. In the United States, the National Research Council (1989) provides some assistance in designing warnings. They emphasize the importance of two-way communication in enhancing understanding. The communicator should facilitate information feedback and questions on the part of the recipient. The conclusions of the report are summarized in two checklists, one for use by managers, the other serving as a guide for the recipient of the information.
Risk Acceptance
The concept of risk acceptance asks the question, “How safe is safe enough?” or, in more precise terms, “The conditional nature of risk assessment raises the question of which standard of risk we should accept against which to calibrate human biases” (Pidgeon 1991). This question takes importance in issues such as: (1) Should there be an additional containment shell around nuclear power plants? (2) Should schools containing asbestos be closed? or (3) Should one avoid all possible trouble, at least in the short run? Some of these questions are aimed at government or other regulatory bodies; others are aimed at the individual who must decide between certain actions and possible uncertain dangers.
The question whether to accept or reject risks is the result of decisions made to determine the optimal level of risk for a given situation. In many instances, these decisions will follow as an almost automatic result of the exercise of perceptions and habits acquired from experience and training. However, whenever a new situation arises or changes in seemingly familiar tasks occur, such as in performing non-routine or semi-routine tasks, decision making becomes more complex. To understand more about why people accept certain risks and reject others we shall need to define first what risk acceptance is. Next, the psychological processes that lead to either acceptance or rejection have to be explained, including influencing factors. Finally, methods to change too high or too low levels of risk acceptance will be addressed.
Understanding Risk
Generally speaking, whenever risk is not rejected, people have either voluntarily, thoughtlessly or habitually accepted it. Thus, for example, when people participate in traffic, they accept the danger of damage, injury, death and pollution for the opportunity of benefits resulting from increased mobility; when they decide to undergo surgery or not to undergo it, they decide that the costs and/or benefits of either decision are greater; and when they are investing money in the financial market or deciding to change business products, all decisions accepting certain financial dangers and opportunities are made with some degree of uncertainty. Finally, the decision to work in any job also has varying probabilities of suffering an injury or fatality, based on statistical accident history.
Defining risk acceptance by referring only to what has not been rejected leaves two important issues open; (1) what exactly is meant by the term risk, and (2) the often made assumption that risks are merely potential losses that have to be avoided, while in reality there is a difference between merely tolerating risks, fully accepting them, or even wishing for them to occur to enjoy thrill and excitement. These facets might all be expressed through the same behaviour (such as participating in traffic) but have different underlying cognitive, emotional and physiological processes. It seems obvious that a merely tolerated risk relates to a different level of commitment than if one even has the desire for a certain thrill, or “risky” sensation. Figure 1 summarizes facets of risk acceptance.
Figure 1. Facets of risk acceptance and risk rejection
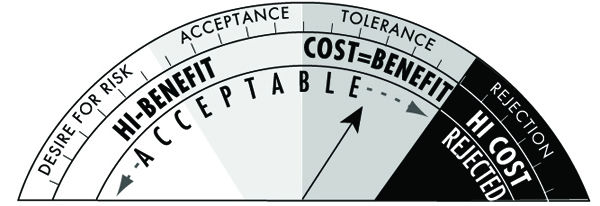
If one looks up the term risk in the dictionaries of several languages, it often has the double meaning of “chance, opportunity” on one hand and “danger, loss” (e.g., wej-ji in Chinese, Risiko in German, risico in Dutch and Italian, risque in French, etc.) on the other. The word risk was created and became popular in the sixteenth century as a consequence of a change in people’s perceptions, from being totally manipulated by “good and evil spirits,” towards the concept of the chance and danger of every free individual to influence his or her own future. (Probable origins of risk lie in the Greek word rhiza, meaning “root and/or cliff”, or the Arabic word rizq meaning “what God and fate provide for your life”.) Similarly, in our everyday language we use proverbs such as “Nothing ventured, nothing gained” or “God helps the brave”, thereby promoting risk taking and risk acceptance. The concept always related to risk is that of uncertainty. As there is almost always some uncertainty about success or failure, or about the probability and quantity of consequences, accepting risks always means accepting uncertainties (Schäfer 1978).
Safety research has largely reduced the meaning of risk to its dangerous aspects (Yates 1992b). Only lately have positive consequences of risk re-emerged with the increase in adventurous leisure time activities (bungee jumping, motorcycling, adventure travels, etc.) and with a deeper understanding of how people are motivated to accept and take risks (Trimpop 1994). It is argued that we can understand and influence risk acceptance and risk taking behaviour only if we take the positive aspects of risks into account as well as the negative.
Risk acceptance therefore refers to the behaviour of a person in a situation of uncertainty that results from the decision to engage in that behaviour (or not to engage in it), after weighing the estimated benefits as greater (or lesser) than the costs under the given circumstances. This process can be extremely quick and not even enter the conscious decision-making level in automatic or habitual behaviour, such as shifting gears when the noise of the engine rises. At the other extreme, it may take very long and involve deliberate thinking and debates among several people, such as when planning a hazardous operation such as a space flight.
One important aspect of this definition is that of perception. Because perception and subsequent evaluation is based on a person’s individual experiences, values and personality, the behavioural acceptance of risks is based more on subjective risk than on objective risk. Furthermore, as long as a risk is not perceived or considered, a person cannot respond to it, no matter how grave the hazard. Thus, the cognitive process leading to the acceptance of risk is an information-processing and evaluation procedure residing within each person that can be extremely quick.
A model describing the identification of risks as a cognitive process of identification, storage and retrieval was discussed by Yates and Stone (1992). Problems can arise at each stage of the process. For example, accuracy in the identification of risks is rather unreliable, especially in complex situations or for dangers such as radiation, poison or other not easily perceptible stimuli. Furthermore, the identification, storage and retrieval mechanisms underlie common psychological phenomena, such as primacy and recency effects, as well as familiarity habituation. That means that people familiar with a certain risk, such as driving at high speed, will get used to it, accept it as a given “normal” situation and estimate the risk at a far lower value than people not familiar with the activity. A simple formalization of the process is a model with the components of:
Stimulus → Perception → Evaluation → Decision → Behaviour → Feedback loop
For example, a slowly moving vehicle in front of a driver may be the stimulus to pass. Checking the road for traffic is perception. Estimating the time needed to pass, given the acceleration capabilities of one’s car, is evaluation. The value of saving time leads to the decision and following behaviour to pass the car or not. The degree of success or failure is noticed immediately and this feedback influences subsequent decisions about passing behaviour. At each step of this process, the final decision whether to accept or reject risks can be influenced. Costs and benefits are evaluated based on individual-, context- and object-related factors that have been identified in scientific research to be of importance for risk acceptance.
Which Factors Influence Risk Acceptance?
Fischhoff et al. (1981) identified the factors (1) individual perception, (2) time, (3) space and (4) context of behaviour, as important dimensions of risk taking that should be considered in studying risks. Other authors have used different categories and different labels for the factors and contexts influencing risk acceptance. The categories of properties of the task or risk object, individual factors and context factors have been used to structure this large number of influential factors, as summarized in figure 2.
Figure 2. Factors influencing risk acceptance
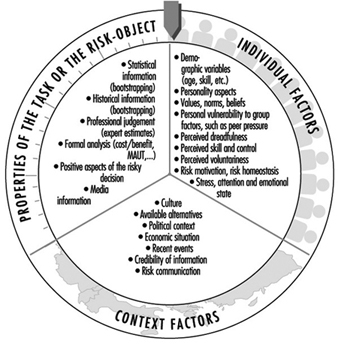
In normal models of risk acceptance, consequences of new technological risks (e.g., genetic research) were often described by quantitative summary measures (e.g., deaths, damage, injuries), and probability distributions over consequences were arrived at through estimation or simulation (Starr 1969). Results were compared to risks already “accepted” by the public, and thus offered a measure of acceptability of the new risk. Sometimes data were presented in a risk index to compare the different types of risk. The methods used most often were summarized by Fischhoff et al. (1981) as professional judgement by experts, statistical and historical information and formal analyses, such as fault tree analyses. The authors argued that properly conducted formal analyses have the highest “objectivity” as they separate facts from beliefs and take many influences into account. However, safety experts stated that the public and individual acceptance of risks may be based on biased value judgements and on opinions publicized by the media, and not on logical analyses.
It has been suggested that the general public is often misinformed by the media and political groups that produce statistics in favour of their arguments. Instead of relying on individual biases, only professional judgements based on expert knowledge should be used as a basis for accepting risks, and the general public should be excluded from such important decisions. This has drawn substantial criticism as it is viewed as a question of both democratic values (people should have a chance to decide issues that may have catastrophic consequences for their health and safety) and social values (does the technology or risky decision benefit receivers more than those who pay the costs). Fischhoff, Furby and Gregory (1987) suggested the use of either expressed preferences (interviews, questionnaires) or revealed preferences (observations) of the “relevant” public to determine the acceptability of risks. Jungermann and Rohrmann have pointed out the problems of identifying who is the “relevant public” for technologies such as nuclear power plants or genetic manipulations, as several nations or the world population may suffer or benefit from the consequences.
Problems with solely relying on expert judgements have also been discussed. Expert judgements based on normal models approach statistical estimations more closely than those of the public (Otway and von Winterfeldt 1982). However, when asked specifically to judge the probability or frequency of death or injuries related to a new technology, the public’s views are much more similar to the expert judgements and to the risk indices. Research also showed that although people do not change their first quick estimate when provided with data, they do change when realistic benefits or dangers are raised and discussed by experts. Furthermore, Haight (1986) pointed out that because expert judgements are subjective, and experts often disagree about risk estimates, that the public is sometimes more accurate in its estimate of riskiness, if judged after the accident has occurred (e.g., the catastrophe at Chernobyl). Thus, it is concluded that the public uses other dimensions of risk when making judgements than statistical number of deaths or injuries.
Another aspect that plays a role in accepting risks is whether the perceived effects of taking risks are judged positive, such as adrenaline high, “flow” experience or social praise as a hero. Machlis and Rosa (1990) discussed the concept of desired risk in contrast to tolerated or dreaded risk and concluded that in many situations increased risks function as an incentive, rather than as a deterrent. They found that people may behave not at all averse to risk in spite of media coverage stressing the dangers. For example, amusement park operators reported a ride becoming more popular when it reopened after a fatality. Also, after a Norwegian ferry sank and the passengers were set afloat on icebergs for 36 hours, the operating company experienced the greatest demand it had ever had for passage on its vessels. Researchers concluded that the concept of desired risk changes the perception and acceptance of risks, and demands different conceptual models to explain risk-taking behaviour. These assumptions were supported by research showing that for police officers on patrol the physical danger of being attacked or killed was ironically perceived as job enrichment, while for police officers engaged in administrative duties, the same risk was perceived as dreadful. Vlek and Stallen (1980) suggested the inclusion of more personal and intrinsic reward aspects in cost/benefit analyses to explain the processes of risk assessment and risk acceptance more completely.
Individual factors influencing risk acceptance
Jungermann and Slovic (1987) reported data showing individual differences in perception, evaluation and acceptance of “objectively” identical risks between students, technicians and environmental activists. Age, sex and level of education have been found to influence risk acceptance, with young, poorly educated males taking the highest risks (e.g., wars, traffic accidents). Zuckerman (1979) provided a number of examples for individual differences in risk acceptance and stated that they are most likely influenced by personality factors, such as sensation seeking, extroversion, overconfidence or experience seeking. Costs and benefits of risks also contribute to individual evaluation and decision processes. In judging the riskiness of a situation or action, different people reach a wide variety of verdicts. The variety can manifest itself in terms of calibration—for example, due to value-induced biases which let the preferred decision appear less risky so that overconfident people choose a different anchor value. Personality aspects, however, account for only 10 to 20% of the decision to accept a risk or to reject it. Other factors have to be identified to explain the remaining 80 to 90%.
Slovic, Fischhoff and Lichtenstein (1980) concluded from factor-analytical studies and interviews that non-experts assess risks qualitatively differently by including the dimensions of controllability, voluntariness, dreadfulness and whether the risk has been previously known. Voluntariness and perceived controllability were discussed in great detail by Fischhoff et al. (1981). It is estimated that voluntarily chosen risks (motorcycling, mountain climbing) have a level of acceptance which is about 1,000 times as high as that of involuntarily chosen, societal risks. Supporting the difference between societal and individual risks, the importance of voluntariness and controllability has been posited in a study by von Winterfeldt, John and Borcherding (1981). These authors reported lower perceived riskiness for motorcycling, stunt work and auto racing than for nuclear power and air traffic accidents. Renn (1981) reported a study on voluntariness and perceived negative effects. One group of subjects was allowed to choose between three types of pills, while the other group was administered these pills. Although all pills were identical, the voluntary group reported significantly fewer “side-effects” than the administered group.
When risks are individually perceived as having more dreadful consequences for many people, or even catastrophic consequences with a near zero probability of occurrence, these risks are often judged as unacceptable in spite of the knowledge that there have not been any or many fatal accidents. This holds even more true for risks previously unknown to the person judging. Research also shows that people use their personal knowledge and experience with the particular risk as the key anchor of judgement for accepting well-defined risks while previously unknown risks are judged more by levels of dread and severity. People are more likely to underestimate even high risks if they have been exposed for an extended period of time, such as people living below a power dam or in earthquake zones, or having jobs with a “habitually” high risk, such as in underground mining, logging or construction (Zimolong 1985). Furthermore, people seem to judge human-made risks very differently from natural risks, accepting natural ones more readily than self-constructed, human-made risks. The approach used by experts to base risks for new technologies within the low-end and high-end “objective risks” of already accepted or natural risks seems not to be perceived as adequate by the public. It can be argued that already “accepted risks” are merely tolerated, that new risks add on to the existing ones and that new dangers have not been experienced and coped with yet. Thus, expert statements are essentially viewed as promises. Finally, it is very hard to determine what has been truly accepted, as many people are seemingly unaware of many risks surrounding them.
Even if people are aware of the risks surrounding them, the problem of behavioural adaptation occurs. This process is well described in risk compensation and risk homeostasis theory (Wilde 1986), which states that people adjust their risk acceptance decision and their risk-taking behaviour towards their target level of perceived risk. That means that people will behave more cautiously and accept fewer risks when they feel threatened, and, conversely, they will behave more daringly and accept higher levels of risk when they feel safe and secure. Thus, it is very difficult for safety experts to design safety equipment, such as seat-belts, ski boots, helmets, wide roads, fully enclosed machinery and so on, without the user’s offsetting the possible safety benefit by some personal benefit, such as increased speed, comfort, decreased attention or other more “risky” behaviour.
Changing the accepted level of risk by increasing the value of safe behaviour may increase the motivation to accept the less dangerous alternative. This approach aims at changing individual values, norms and beliefs to motivate alternative risk acceptance and risk-taking behaviour. Among the factors that increase or decrease the likelihood of risk acceptance, are those such as whether the technology provides a benefit corresponding to present needs, increases the standard of living, creates new jobs, facilitates economic growth, enhances national prestige and independence, requires strict security measures, increases the power of big business, or leads to centralization of political and economic systems (Otway and von Winterfeldt 1982). Similar influences of situational frames on risk evaluations were reported by Kahneman and Tversky (1979 and 1984). They reported that if they phrased the outcome of a surgical or radiation therapy as 68% probability of survival, 44% of the subjects chose it. This can be compared to only 18% who chose the same surgical or radiation therapy, if the outcome was phrased as 32% probability of death, which is mathematically equivalent. Often subjects choose a personal anchor value (Lopes and Ekberg 1980) to judge the acceptability of risks, especially when dealing with cumulative risks over time.
The influence of “emotional frames” (affective context with induced emotions) on risk assessment and acceptance was shown by Johnson and Tversky (1983). In their frames, positive and negative emotions were induced through descriptions of events such as personal success or the death of a young man. They found that subjects with induced negative feelings judged the risks of accidental and violent fatality rates as significantly higher, regardless of other context variables, than subjects of the positive emotional group. Other factors influencing individual risk acceptance include group values, individual beliefs, societal norms, cultural values, the economic and political situation, and recent experiences, such as seeing an accident. Dake (1992) argued that risk is—apart from its physical component—a concept very much dependent on the respective system of beliefs and myths within a cultural frame. Yates and Stone (1992) listed the individual biases (figure 3) that have been found to influence the judgement and acceptance of risks.
Figure 3. Individual biases that influence risk evaluation and risk acceptance
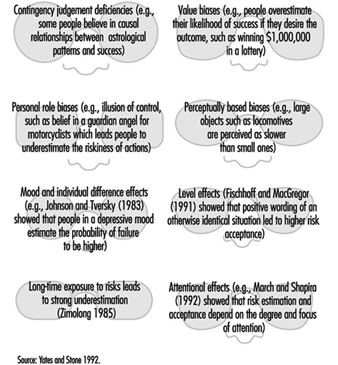
Cultural factors influencing risk acceptance
Pidgeon (1991) defined culture as the collection of beliefs, norms, attitudes, roles and practices shared within a given social group or population. Differences in cultures lead to different levels of risk perception and acceptance, for example in comparing the work safety standards and accident rates in industrialized countries with those in developing countries. In spite of the differences, one of the most consistent findings across cultures and within cultures is that usually the same concepts of dreadfulness and unknown risks, and those of voluntariness and controllability emerge, but they receive different priorities (Kasperson 1986). Whether these priorities are solely culture dependent remains a question of debate. For example, in estimating the hazards of toxic and radioactive waste disposal, British people focus more on transportation risks; Hungarians more on operating risks; and Americans more on environmental risks. These differences are attributed to cultural differences, but may just as well be the consequence of a perceived population density in Britain, operating reliability in Hungary and the environmental concerns in the United States, which are situational factors. In another study, Kleinhesselink and Rosa (1991) found that Japanese perceive atomic power as a dreadful but not unknown risk, while for Americans atomic power is a predominantly unknown source of risk.
The authors attributed these differences to different exposure, such as to the atomic bombs dropped on Hiroshima and Nagasaki in 1945. However, similar differences were reported between Hispanic and White American residents of the San Francisco area. Thus, local cultural, knowledge and individual differences may play an equally important role in risk perception as general cultural biases do (Rohrmann 1992a).
These and similar discrepancies in conclusions and interpretations derived from identical facts led Johnson (1991) to formulate cautious warnings about the causal attribution of cultural differences to risk perception and risk acceptance. He worried about the widely spread differences in the definition of culture, which make it almost an all-encompassing label. Moreover, differences in opinions and behaviours of subpopulations or individual business organizations within a country add further problems to a clear-cut measurement of culture or its effects on risk perception and risk acceptance. Also, the samples studied are usually small and not representative of the cultures as a whole, and often causes and effects are not separated properly (Rohrmann 1995). Other cultural aspects examined were world views, such as individualism versus egalitarianism versus belief in hierarchies, and social, political, religious or economic factors.
Wilde (1994) reported, for example, that the number of accidents is inversely related to a country’s economic situation. In times of recession the number of traffic accidents drops, while in times of growth the number of accidents rises. Wilde attributed these findings to a number of factors, such as that in times of recession since more people are unemployed and gasoline and spare parts are more costly, people will consequently take more care to avoid accidents. On the other hand, Fischhoff et al. (1981) argued that in times of recession people are more willing to accept dangers and uncomfortable working conditions in order to keep a job or to get one.
The role of language and its use in mass media were discussed by Dake (1991), who cited a number of examples in which the same “facts” were worded such that they supported the political goals of specific groups, organizations or governments. For example, are worker complaints about suspected occupational hazards “legitimate concerns” or “narcissistic phobias”? Is hazard information available to the courts in personal injury cases “sound evidence” or “scientific flotsam”? Do we face ecological “nightmares” or simply “incidences” or “challenges”? Risk acceptance thus depends on the perceived situation and context of the risk to be judged, as well as on the perceived situation and context of the judges themselves (von Winterfeldt and Edwards 1984). As the previous examples show, risk perception and acceptance strongly depend on the way the basic “facts” are presented. The credibility of the source, the amount and type of media coverage—in short, risk communication—is a factor determining risk acceptance more often than the results of formal analyses or expert judgements would suggest. Risk communication is thus a context factor that is specifically used to change risk acceptance.
Changing Risk Acceptance
To best achieve a high degree of acceptance for a change, it has proven very successful to include those who are supposed to accept the change in the planning, decision and control process to bind them to support the decision. Based on successful project reports, figure 4 lists six steps that should be considered when dealing with risks.
Figure 4. Six steps for choosing, deciding upon and accepting optimal risks
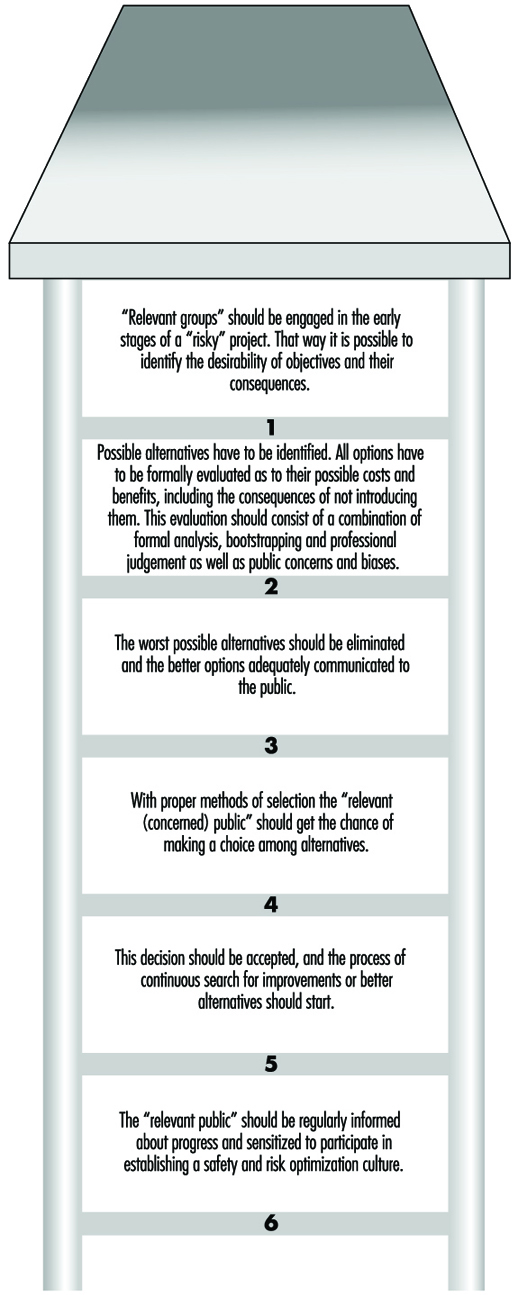
Determining “optimal risks”
In steps 1 and 2, major problems occur in identifying the desirability and the “objective risk” of the objective. while in step 3, it seems to be difficult to eliminate the worst options. For individuals and organizations alike, large-scale societal, catastrophic or lethal dangers seem to be the most dreaded and least acceptable options. Perrow (1984) argued that most societal risks, such as DNA research, power plants, or the nuclear arms race, possess many closely coupled subsystems, meaning that if one error occurs in a subsystem, it can trigger many other errors. These consecutive errors may remain undetected, due to the nature of the initial error, such as a nonfunctioning warning sign. The risks of accidents happening due to interactive failures increases in complex technical systems. Thus, Perrow (1984) suggested that it would be advisable to leave societal risks loosely coupled (i.e., independently controllable) and to allow for independent assessment of and protection against risks and to consider very carefully the necessity for technologies with the potential for catastrophic consequences.
Communicating “optimal choices”
Steps 3 to 6 deal with accurate communication of risks, which is a necessary tool to develop adequate risk perception, risk estimation and optimal risk-taking behaviour. Risk communication is aimed at different audiences, such as residents, employees, patients and so on. Risk communication uses different channels such as newspapers, radio, television, verbal communication and all of these in different situations or “arenas”, such as training sessions, public hearings, articles, campaigns and personal communications. In spite of little research on the effectiveness of mass media communication in the area of health and safety, most authors agree that the quality of the communication largely determines the likelihood of attitudinal or behavioural changes in risk acceptance of the targeted audience. According to Rohrmann (1992a), risk communication also serves different purposes, some of which are listed in figure 5.
Figure 5. Purposes of risk communication
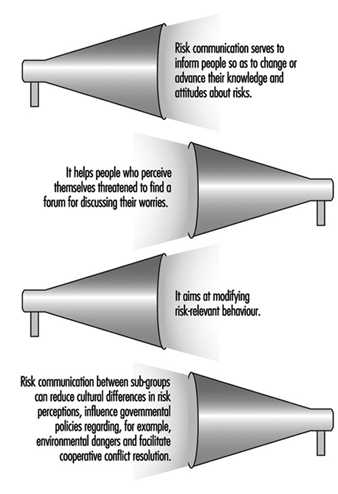
Risk communication is a complex issue, with its effectiveness seldom proven with scientific exactness. Rohrmann (1992a) listed necessary factors for evaluating risk communication and gave some advice about communicating effectively. Wilde (1993) separated the source, the message, the channel and the recipient and gave suggestions for each aspect of communication. He cited data that show, for example, that the likelihood of effective safety and health communication depends on issues such as those listed in figure 6.
Figure 6. Factors influencing the effectiveness of risk communication
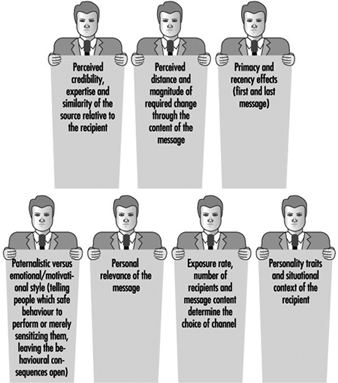
Establishing a risk optimization culture
Pidgeon (1991) defined safety culture as a constructed system of meanings through which a given people or group understands the hazards of the world. This system specifies what is important and legitimate, and explains relationships to matters of life and death, work and danger. A safety culture is created and recreated as members of it repeatedly behave in ways that seem to be natural, obvious and unquestionable and as such will construct a particular version of risk, danger and safety. Such versions of the perils of the world also will embody explanatory schemata to describe the causation of accidents. Within an organization, such as a company or a country, the tacit and explicit rules and norms governing safety are at the heart of a safety culture. Major components are rules for handling hazards, attitudes toward safety, and reflexivity on safety practice.
Industrial organizations that already live an elaborate safety culture emphasize the importance of common visions, goals, standards and behaviours in risk taking and risk acceptance. As uncertainties are unavoidable within the context of work, an optimal balance of taking chances and control of hazards has to be stricken. Vlek and Cvetkovitch (1989) stated:
Adequate risk management is a matter of organizing and maintaining a sufficient degree of (dynamic) control over a technological activity, rather than continually, or just once, measuring accident probabilities and distributing the message that these are, and will be, “negligibly low”. Thus more often than not, “acceptable risk” means “sufficient control”.
Summary
When people perceive themselves to possess sufficient control over possible hazards, they are willing to accept the dangers to gain the benefits. Sufficient control, however, has to be based on sound information, assessment, perception, evaluation and finally an optimal decision in favour of or against the “risky objective”.
" DISCLAIMER: The ILO does not take responsibility for content presented on this web portal that is presented in any language other than English, which is the language used for the initial production and peer-review of original content. Certain statistics have not been updated since the production of the 4th edition of the Encyclopaedia (1998)."