Characteristic Chemical Pollutants
Chemical contaminants of the indoor air can occur as gases and vapors (inorganic and organic) and particulates. Their presence in the indoor environment is the result of entry into the building from the outdoor environment or their generation within the building. The relative importance of these indoor and outdoor origins differs for different pollutants and may vary over time.
The major chemical pollutants commonly found in the indoor air are the following:
- carbon dioxide (CO2), which is a metabolic product and often used as an indicator of the general level of air pollution related to the presence of humans indoors
- carbon monoxide (CO), nitrogen oxides (NOx) and sulphur dioxide (SO2), which are inorganic combustion gases formed predominantly during the combustion of fuels and ozone (O3), which is a product of photochemical reactions in polluted atmospheres but may also be released by some indoor sources
- organic compounds that originate from a variety of indoor sources and outdoors. Hundreds of organic chemicals occur in indoor air although most are present at very low concentrations. These can be grouped according to their boiling points and one widely used classification, shown in Table 1, identifies four groups of organic compounds: (1) very volatile organic compounds (VVOC); (2) volatile (VOC); (3) semi-volatile (SVOC); and (4) organic compounds associated with particulate matter (POM). Particle-phase organics are dissolved in or adsorbed on particulate matter. They may occur in both the vapor and particle phase depending on their volatility. For example, polyaromatic hydrocarbons (PAHs) consisting of two fused benzene rings (e.g., naphthalene) are found principally in the vapor phase and those consisting of five rings (e.g., benz[a]pyrene) are found predominantly in the particle phase.
Table 1. Classification of indoor organic pollutants
|
Category |
Description |
Abbreviation |
Boiling range (ºC) |
Sampling methods typically used in field studies |
|
1 |
Very volatile (gaseous) organic compounds |
VVOC |
0 to 50-100 |
Batch sampling; adsorption on charcoal |
|
2 |
Volatile organic compounds |
VOC |
50-100 to 240-260 |
Adsorption on Tenax, carbon molecular black or charcoal |
|
3 |
Semivolatile organic compounds |
SVOC |
240-260 to 380-400 |
Adsorption on polyurethane foam or XAD-2 |
|
4 |
Organic compounds associated with particulate matter or particulate organic matter |
|
|
|
An important characteristic of indoor air contaminants is that their concentrations vary both spatially and temporally to a greater extent than is common outdoors. This is due to the large variety of sources, the intermittent operation of some of the sources and the various sinks present.
Concentrations of contaminants that arise principally from combustion sources are subject to very large temporal variation and are intermittent. Episodic releases of volatile organic compounds due to human activities such as painting also lead to large variations in emission with time. Other emissions, such as formaldehyde release from wood-based products may vary with temperature and humidity fluctuations in the building, but the emission is continuous. The emission of organic chemicals from other materials may be less dependent upon temperature and humidity conditions but their concentrations in indoor air will be greatly influenced by ventilation conditions.
Spatial variations within a room tend to be less pronounced than temporal variations. Within a building there may be large differences in the case of localized sources, for example, photocopiers in a central office, gas cookers in the restaurant kitchen and tobacco smoking restricted to a designated area.
Sources within the Building
Elevated levels of pollutants generated by combustion, particularly nitrogen dioxide and carbon monoxide in indoor spaces, usually result from unvented, improperly vented or poorly maintained combustion appliances and the smoking of tobacco products. Unvented kerosene and gas space heaters emit significant quantities of CO, CO2, NOx, SO2, particulates and formaldehyde. Gas cooking stoves and ovens also release these products directly into the indoor air. Under normal operating conditions, vented gas-fired forced air heaters and water heaters should not release combustion products into the indoor air. However flue gas spillage and backdrafting can occur with faulty appliances when the room is depressurized by competing exhaust systems and under certain meteorological conditions.
Environmental tobacco smoke
Indoor air contamination from tobacco smoke results from sidestream and exhaled mainstream smoke, usually referred to as environmental tobacco smoke (ETS). Several thousand different constituents have been identified in tobacco smoke and the total quantities of individual components varies depending upon the type of cigarette and the conditions of smoke generation. The main chemicals associated with ETS are nicotine, nitrosamines, PAHs, CO, CO2, NOx, acrolein, formaldehyde and hydrogen cyanide.
Building materials and furnishings
The materials which have received greatest attention as sources of indoor air pollution have been wood-based boards containing urea formaldehyde (UF) resin and UF cavity wall insulation (UFFI). Emission of formaldehyde from these products results in elevated levels of formaldehyde in buildings and this has been associated with many complaints of poor indoor air quality in developed countries, particularly during the late 1970s and early 1980s. Table 2 gives examples of materials that release formaldehyde in buildings. These show that the highest emission rates may be associated with the wood-based products and UFFI which are products often used extensively in buildings. Particleboard is manufactured from fine (about 1 mm) wood particles which are mixed with UF resins (6 to 8 weight%) and pressed into wood panels. It is widely used for flooring, wall panelling, shelving and components of cabinets and furniture. The plies of hardwood are bonded with UF resin and are commonly used for decorative wall panelling and components of furniture. Medium-density fibreboard (MDF) contains finer wood particles than those used in particleboard and these are also bound with UF resin. MDF is most often used for furniture. The primary source of formaldehyde in all these products is the residual formaldehyde trapped in the resin as a result of its presence in excess needed for the reaction with urea during the manufacture of the resin. Release is therefore highest when the product is new, and declines at a rate dependent upon product thickness, initial emission strength, presence of other formaldehyde sources, local climate and occupant behaviour. The initial decline rate of emissions may be 50% over the first eight to nine months, followed by a much slower rate of decline. Secondary emission can occur due to hydrolysis of the UF resin and hence emission rates increase during periods of elevated temperature and humidity. Considerable efforts by manufacturers have led to the development of lower-emitting materials by use of lower ratios (i.e. closer to 1:1) of urea to formaldehyde for resin production and the use of formaldehyde scavengers. Regulation and consumer demand have resulted in widespread use of these products in some countries.
Table 2. Formaldehyde emission rates from a variety of construction material furnishings and consumer products
|
Range of formaldehyde emission rates (mg/m2/day) |
|
|
Medium-density fiberboard |
17,600-55,000 |
|
Hardwood plywood panelling |
1,500-34,000 |
|
Particleboard |
2,000-25,000 |
|
Urea-formaldehyde foam insulation |
1,200-19,200 |
|
Softwood plywood |
240-720 |
|
Paper products |
260-680 |
|
Fiberglass products |
400-470 |
|
Clothing |
35-570 |
|
Resilient flooring |
240 |
|
Carpeting |
0-65 |
|
Upholstery fabric |
0-7 |
Building materials and furnishings release a wide range of other VOCs which have been the subject of increasing concern during the 1980s and 1990s. The emission can be a complex mixture of individual compounds, though a few may be dominant. A study of 42 building materials identified 62 different chemical species. These VOCs were primarily aliphatic and aromatic hydrocarbons, their oxygen derivatives and terpenes. The compounds with the highest steady-state emission concentrations, in decreasing order, were toluene, m-xylene, terpene, n-butylacetate, n-butanol, n-hexane, p-xylene, ethoxyethylacetate, n-heptane and o-xylene. The complexity of emission has resulted in emissions and concentrations in air often being reported as the total volatile organic compound (TVOC) concentration or release. Table 3 gives examples of rates of TVOC emission for a range of building products. These show that significant differences in emissions exist between products, which means that if adequate data were available materials could be selected at the planning stage to minimize the VOC release in newly constructed buildings.
Table 3. Total volatile organic compound (TVOC) concentrations and emission rates associated with various floor and wall coverings and coatings
|
Type of material |
Concentrations (mg/m3) |
Emission rate |
|
Wallpaper |
||
|
Vinyl and paper |
0.95 |
0.04 |
|
Vinyl and glass fibres |
7.18 |
0.30 |
|
Printed paper |
0.74 |
0.03 |
|
Wall covering |
||
|
Hessian |
0.09 |
0.005 |
|
PVCa |
2.43 |
0.10 |
|
Textile |
39.60 |
1.60 |
|
Textile |
1.98 |
0.08 |
|
Floor covering |
||
|
Linoleum |
5.19 |
0.22 |
|
Synthetic fibres |
1.62 |
0.12 |
|
Rubber |
28.40 |
1.40 |
|
Soft plastic |
3.84 |
0.59 |
|
Homogeneous PVC |
54.80 |
2.30 |
|
Coatings |
||
|
Acrylic latex |
2.00 |
0.43 |
|
Varnish, clear epoxy |
5.45 |
1.30 |
|
Varnish, polyurethane, |
28.90 |
4.70 |
|
Varnish, acid-hardened |
3.50 |
0.83 |
a PVC, polyvinyl chloride.
Wood preservatives have been shown to be a source of pentachlorophenol and lindane in the air and in dust within buildings. They are used primarily for timber protection for outdoor exposure and are also used in biocides applied for treatment of dry rot and insect control.
Consumer products and other indoor sources
The variety and number of consumer and household products change constantly, and their chemical emissions depend on use patterns. Products that may contribute to indoor VOC levels include aerosol products, personal hygiene products, solvents, adhesives and paints. Table 4 illustrates major chemical components in a range of consumer products.
Table 4. Components and emissions from consumer products and other sources of volatile organic compounds (VOC)
|
Source |
Compound |
Emission rate |
|
Cleaning agents and |
Chloroform |
15 μg/m2.h |
|
Moth cake |
p-Dichlorobenzene |
14,000 μg/m2.h |
|
Dry-cleaned clothes |
Tetrachloroethylene |
0.5-1 mg/m2.h |
|
Liquid floor wax |
TVOC (trimethylpentene and |
96 g/m2.h |
|
Paste leather wax |
TVOC (pinene and 2-methyl- |
3.3 g/m2.h |
|
Detergent |
TVOC (limonene, pinene and |
240 mg/m2.h |
|
Human emissions |
Acetone |
50.7 mg/day |
|
Copy paper |
Formaldehyde |
0.4 μg/form |
|
Steam humidifier |
Diethylaminoethanol, |
— |
|
Wet copy machine |
2,2,4-Trimethylheptane |
— |
|
Household solvents |
Toluene, ethyl benzene |
— |
|
Paint removers |
Dichloromethane, methanol |
— |
|
Paint removers |
Dichloromethane, toluene, |
— |
|
Fabric protector |
1,1,1-Trichloroethane, pro- |
— |
|
Latex paint |
2-Propanol, butanone, ethyl- |
— |
|
Room freshener |
Nonane, decane, ethyl- |
— |
|
Shower water |
Chloroform, trichloroethylene |
— |
Other VOCs have been associated with other sources. Chloroform is introduced into the indoor air chiefly as a result of dispensing or heating tap water. Liquid process copiers release isodecanes into the air. Insecticides used to control cockroaches, termites, fleas, flies, ants and mites are widely used as sprays, fogging devices, powders, impregnated strips, bait and pet collars. Compounds include diazinon, paradichlorobenzene, pentachlorophenol, chlordane, malathion, naphthalene and aldrin.
Other sources include occupants (carbon dioxide and odours), office equipment (VOCs and ozone), mould growth (VOCs, ammonia, carbon dioxide), contaminated land (methane, VOCs) and electronic air cleaners and negative ion generators (ozone).
Contribution from the external environment
Table 5 shows typical indoor-outdoor ratios for the major types of pollutant that occur in indoor air and average concentrations measured in outdoor air of urban areas in the United Kingdom. Sulphur dioxide in the indoor air is normally of outdoor origin and results from both natural and anthropogenic sources. Combustion of fossil fuels containing sulphur and smelting of sulphide ores are major sources of sulphur dioxide in the troposphere. Background levels are very low (1 ppb) but in urban areas maximum hourly concentrations may be 0.1 to 0.5 ppm. Sulphur dioxide can enter a building in air used for ventilation and can infiltrate through small gaps in the building structure. This depends upon the airtightness of the building, meteorological conditions and internal temperatures. Once inside, the incoming air will mix and be diluted by the indoor air. Sulphur dioxide that comes into contact with building and furnishing materials is adsorbed and this can significantly reduce the indoor concentration with respect to the outdoors, particularly when outdoor sulphur dioxide levels are high.
Table 5. Major types of chemical indoor air contaminant and their concentrations in the urban United Kingdom
|
Substance/group of |
Ratio of concentrations |
Typical urban con- |
|
Sulphur dioxide |
~0.5 |
10-20 ppb |
|
Nitrogen dioxide |
≤5-12 (indoor sources) |
10-45 ppb |
|
Ozone |
0.1-0.3 |
15-60 ppb |
|
Carbon dioxide |
1-10 |
350 ppm |
|
Carbon monoxide |
≤5-11 (indoor source) |
0.2-10 ppm |
|
Formaldehyde |
≤10 |
0.003 mg/m3 |
|
Other organic compounds |
1-50 |
|
|
Suspended particles |
0.5-1 (excluding ETSa) |
50-150 μg/m3 |
a ETS, environmental tobacco smoke.
Nitrogen oxides are a product of combustion, and major sources include automobile exhaust, fossil fuel-fired electric generating stations and home space heaters. Nitric oxide (NO) is relatively non-toxic but can be oxidized to nitrogen dioxide (NO2), particularly during episodes of photochemical pollution. Background concentrations of nitrogen dioxide are about 1 ppb but may reach 0.5 ppm in urban areas. The outdoors is the major source of nitrogen dioxide in buildings without unvented fuel appliances. As with sulphur dioxide, adsorption by internal surfaces reduces the concentration indoors compared with that outdoors.
Ozone is produced in the troposphere by photochemical reactions in polluted atmospheres, and its generation is a function of intensity of sunlight and concentration of nitrogen oxides, reactive hydrocarbons and carbon monoxide. At remote sites, background ozone concentrations are 10 to 20 ppb and can exceed 120 ppb in urban areas in summer months. Indoor concentrations are significantly lower due to reaction with indoor surfaces and the lack of strong sources.
Carbon monoxide release as a result of anthropogenic activities is estimated to account for 30% of that present in the atmosphere of the northern hemisphere. Background levels are approximately 0.19 ppm and in urban areas a diurnal pattern of concentrations is related to use of the motor vehicle with peak hourly levels ranging from 3 ppm to 50 to 60 ppm. It is a relatively unreactive substance and so is not depleted by reaction or adsorption on indoor surfaces. Indoor sources such as unvented fuel appliances therefore add to the background level otherwise due to the outdoor air.
The indoor-outdoor relationship of organic compounds is compound-specific and may vary over time. For compounds with strong indoor sources such as formaldehyde, indoor concentrations are usually dominant. For formaldehyde outdoor concentrations are typically below 0.005 mg/m3 and indoor concentrations are ten times higher than outdoor values. Other compounds such as benzene have strong outdoor sources, petrol-driven vehicles being of particular importance. Indoor sources of benzene include ETS and these result in mean concentrations in buildings in the United Kingdom being 1.3 times higher than those outdoors. The indoor environment appears not to be a significant sink for this compound and it is therefore not protective against benzene from outdoors.
Typical Concentrations in Buildings
Carbon monoxide concentrations in indoor environments commonly range from 1 to 5 ppm. Table 6 summarizes results reported in 25 studies. Concentrations are higher in the presence of environmental tobacco smoke, though it is exceptional for concentrations to exceed 15 ppm.
Table 6. Summary of field measurements of nitrogen oxides (NOx) and carbon monoxide (CO)
|
Site |
NOx values (ppb) |
CO mean values |
|
Offices |
||
|
Smoking |
42-51 |
1.0-2.8 |
|
Other workplaces |
||
|
Smoking |
NDa-82 |
1.4-4.2 |
|
Transportation |
||
|
Smoking |
150-330 |
1.6-33 |
|
Restaurants and cafeterias |
||
|
Smoking |
5-120 |
1.2-9.9 |
|
Bars and taverns |
||
|
Smoking |
195 |
3-17 |
a ND = not detected.
Nitrogen dioxide concentrations indoors are typically 29 to 46 ppb. If particular sources such as gas stoves are present, concentrations may be significantly higher, and smoking can have a measurable effect (see table 6).
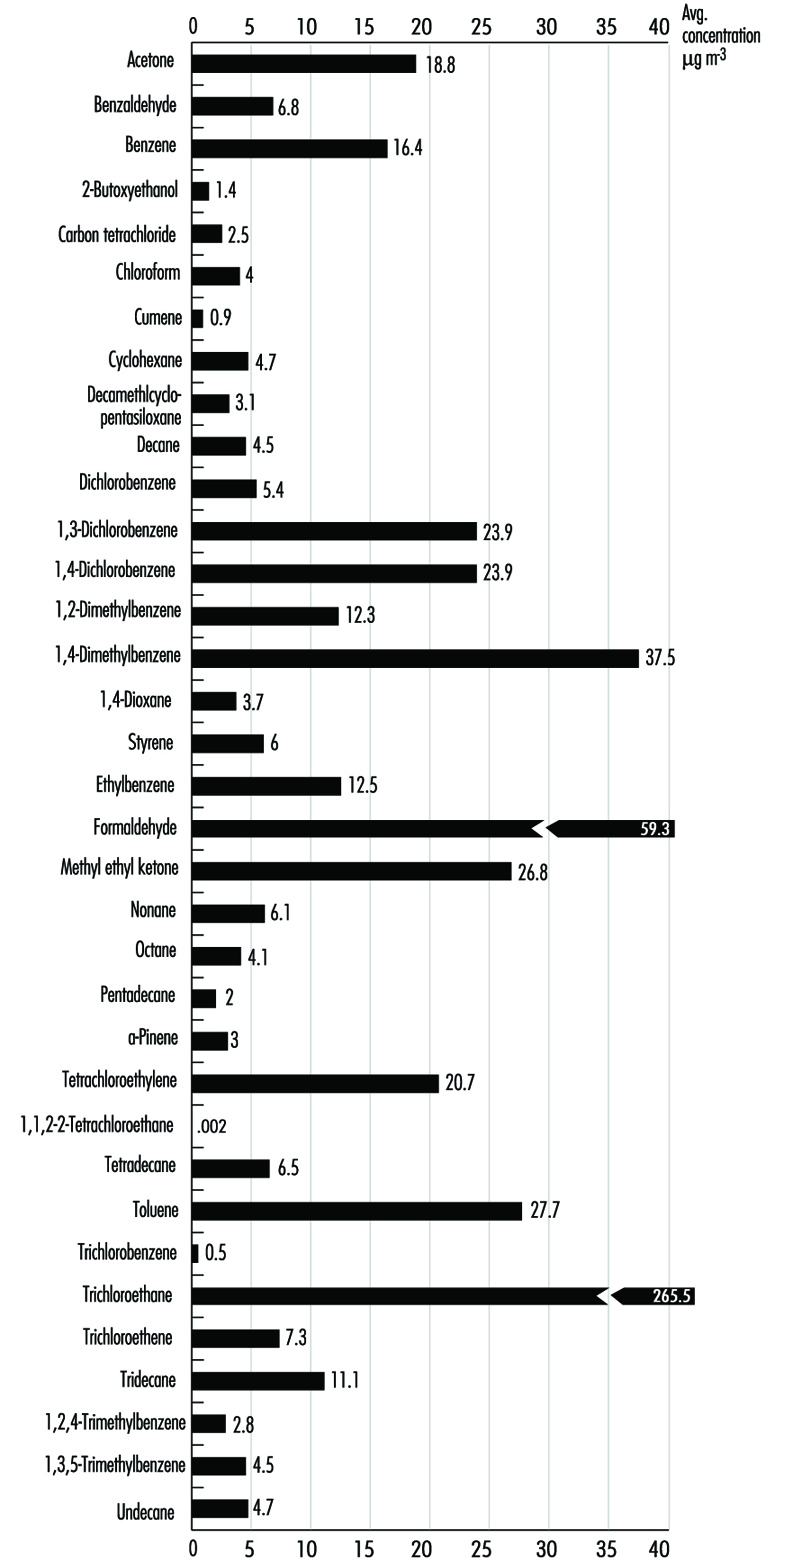
Many VOCs are present in the indoor environment at concentrations ranging from approximately 2 to 20 mg/m3. A US database containing 52,000 records on 71 chemicals in homes, public buildings and offices is summarized in Figure 3. Environments where heavy smoking and/or poor ventilation create high concentrations of ETS can produce VOC concentrations of 50 to 200 mg/m3. Building materials make a significant contribution to indoor concentrations and new homes are likely to have a greater number of compounds exceeding 100 mg/m3. Renovation and painting contribute to significantly higher VOC levels. Concentrations of compounds such as ethyl acetate, 1,1,1-trichloroethane and limonene can exceed 20 mg/m3 during occupant activities, and during residents’ absence the concentration of a range of VOCs may decrease by about 50%. Specific cases of elevated concentrations of contaminants due to materials and furnishings being associated with occupant complaints have been described. These include white spirit from injected damp-proof courses, naphthalene from products containing coal tar, ethylhexanol from vinyl flooring and formaldehyde from wood-based products.
Figure 1. Daily indoor concentrations of selected compounds for indoor sites.
The large number of individual VOCs occurring in buildings makes it difficult to detail concentrations for more than selected compounds. The concept of TVOC has been used as a measure of the mixture of compounds present. There is no widely used definition as to the range of compounds that the TVOC represents, but some investigators have proposed that limiting concentrations to below 300 mg/m3 should minimize complaints by occupants about indoor air quality.
Pesticides used indoors are of relatively low volatility and concentrations occur in the low microgram-per-cubic-meter range. The volatilized compounds can contaminate dust and all indoor surfaces because of their low vapor pressures and tendency to be adsorbed by indoor materials. PAH concentrations in air are also strongly influenced by their distribution between the gas and aerosol phases. Smoking by occupants can have a strong effect on indoor air concentrations. Concentrations of PAHs range typically range from 0.1 to 99 ng/m3.