- You are here:
-
Home

-
Part XVII. Services and Trade
-
Health Care Facilities and Services
- Healthcare Workers and Infectious Diseases
Batteries
The term battery refers to a collection of individual cells, which can generate electricity though chemical reactions. Cells are categorized as either primary or secondary. In primary cells, the chemical reactions that produce the electron flow are not reversible, and therefore the cells are not easily recharged. Conversely, secondary cells must be charged prior to their use, which is achieved by passing an electrical current through the cell. Secondary cells have the advantage that they can often be repeatedly recharged and discharged through use.
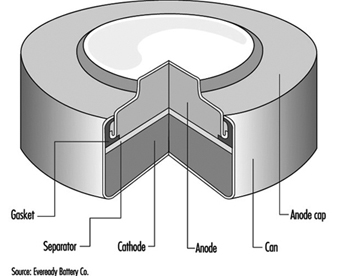
The classic primary battery in everyday use is the Leclanché dry cell, so called because the electrolyte is a paste, not a liquid. The Leclanché cell is typified by the cylindrical batteries used in flashlights, portable radios, calculators, electric toys and the like. In recent years, alkaline batteries, such as the zinc-manganese dioxide cell, have become more prevalent for this type of use. Miniature or “button” batteries have found use in hearing aids, computers, watches, cameras and other electronic equipment. The silver oxide-zinc cell, mercury cell, the zinc-air cell, and the lithium-manganese dioxide cell are some examples. See figure 1 for a cutaway view of a typical alkaline miniature battery.
Figure 1. Cutaway view of alkaline miniature battery
The classic secondary or storage battery is the lead-acid battery, widely used in the transportation industry. Secondary batteries are also used in power plants and industry. Rechargeable, battery-operated tools, toothbrushes, flashlights and the like are a new market for secondary cells. Nickel-cadmium secondary cells are becoming more popular, especially in pocket cells for emergency lighting, diesel starting and stationary and traction applications, where the reliability, long life, frequent rechargeability and low-temperature performance outweigh their extra cost.
Rechargeable batteries under development for use in electric vehicles utilize lithium-ferrous sulphide, zinc-chlorine and sodium-sulphur.
Table 1 gives the composition of some common batteries.
Table 1. Composition of common batteries
|
Type of battery |
Negative electrode |
Positive electrode |
Electrolyte |
|
Primary cells |
|||
|
Leclanché dry cell |
Zinc |
Manganese dioxide |
Water, zinc chloride, ammonium chloride |
|
Alkaline |
Zinc |
Manganese dioxide |
Potassium hydroxide |
|
Mercury (Ruben’s cell) |
Zinc |
Mercuric oxide |
Potassium hydroxide, zinc oxide, water |
|
Silver |
Zinc |
Silver oxide |
Potassium hydroxide, zinc oxide, water |
|
Lithium |
Lithium |
Manganese dioxide |
Lithium chlorate, LiCF3SO3 |
|
Lithium |
Lithium |
Sulphur dioxide |
Sulphur dioxide, acetonitrile, lithium bromide |
|
Thionyl chloride |
Lithium aluminium chloride |
||
|
Zinc in air |
Zinc |
Oxygen |
Zinc oxide, potassium hydroxide |
|
Secondary cells |
|||
|
Lead-acid |
Lead |
Lead dioxide |
Dilute sulphuric acid |
|
Nickel-iron (Edison battery) |
Iron |
Nickel oxide |
Potassium hydroxide |
|
Nickel-cadmium |
Cadmium hydroxide |
Nickel hydroxide |
Potassium hydroxide, possibly lithium hydroxide |
|
Silver-zinc |
Zinc powder |
Silver oxide |
Potassium hydroxide |
Manufacturing Processes
While there are clear differences in the manufacture of the different types of batteries, there are several processes which are common: weighing, grinding, mixing, compressing and drying of constituent ingredients. In modern battery plants many of these processes are enclosed and highly automated, using sealed equipment. Therefore, exposure to the various ingredients can occur during weighing and loading and during cleaning of the equipment.
In older battery plants, many of the grinding, mixing and other operations are done manually, or the transfer of ingredients from one step of the process to another is done manually. In these instances, the risk of inhalation of dusts or skin contact with corrosive substances is high. Precautions for dust-producing operations include total enclosure and mechanized handling and weighing of powders, local exhaust ventilation, daily wet mopping and/or vacuuming and wearing of respirators and other personal protective equipment during maintenance operations.
Noise is also a hazard, since compressing machines and wrapping machines are noisy. Noise control methods and hearing conservation programmes are essential.
The electrolytes in many batteries contain corrosive potassium hydroxide. Enclosure and skin and eye protection are indicated precautions. Exposures can also occur to the particulates of toxic metals such as cadmium oxide, mercury, mercuric oxide, nickel and nickel compounds, and lithium and lithium compounds, which are used as anodes or cathodes in particular types of batteries. The lead-acid storage battery, sometimes referred to as the accumulator, can involve considerable lead exposure hazards and is discussed separately in the article “Lead-acid battery manufacture”.
Lithium metal is highly reactive, thus lithium batteries must be assembled in a dry atmosphere in order to avoid the lithium reacting with water vapour. Sulphur dioxide and thionyl chloride, used in some lithium batteries, are respiratory hazards. Hydrogen gas, used in nickel-hydrogen batteries, is a fire and explosion hazard. These, as well as materials in newly developed batteries, will require special precautions.
Leclanché Cells
Leclanché dry-cell batteries are produced as shown in figure 2. The positive electrode or cathode mixture comprises 60 to 70% manganese dioxide, the remainder being made up of graphite, acetylene black, ammonium salts, zinc chloride and water. Dry, finely ground manganese dioxide, graphite and acetylene black are weighed and fed into a grinder-mixer; electrolyte containing water, zinc chloride and ammonium chloride is added, and the prepared mixture is pressed on a hand-fed tableting or agglomerating press. In certain cases, the mixture is dried in an oven, sifted and remoistened before tableting. The tablets are inspected and wrapped on hand-fed machines after being allowed to harden for a few days. The agglomerates are then placed in trays and soaked in electrolyte, and are now ready for assembly.
Figure 2. Leclanché cell battery production
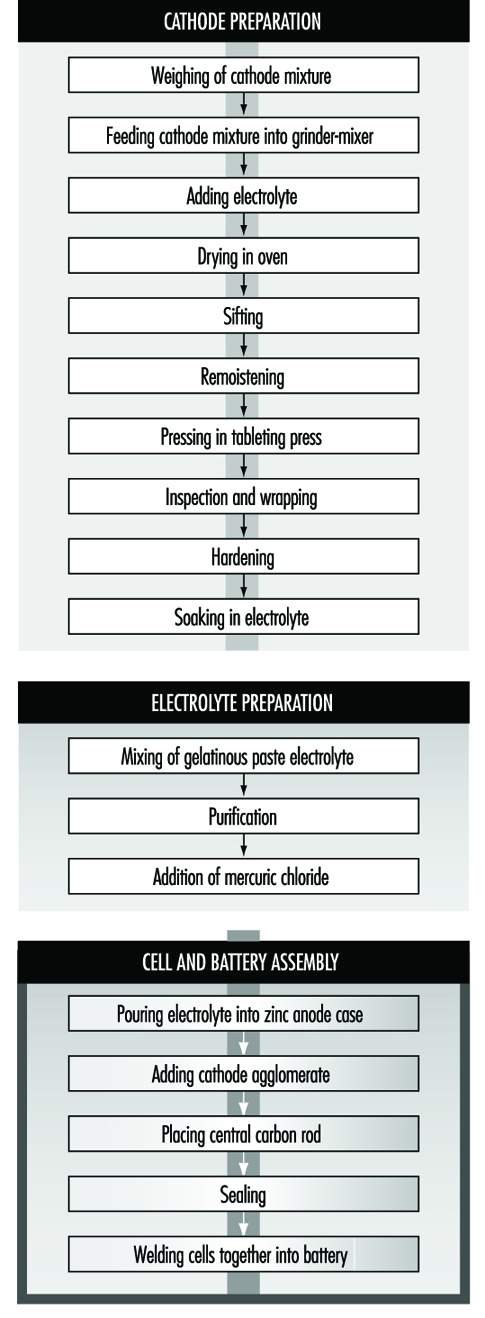
The anode is the zinc case, which is prepared from zinc blanks on a hot press (or zinc sheets are folded and welded to the case). An organic gelatinous paste consisting of maize and flour starches soaked in electrolyte is mixed in large vats. The ingredients are usually poured in from sacks without weighing. The mixture is then purified with zinc chips and manganese dioxide. Mercuric chloride is added to the electrolyte to form an amalgam with the interior of the zinc container. This paste will form the conducting medium or electrolyte.
Cells are assembled by automatic pouring of the required amount of gelatinous paste into the zinc cases to form an inner sleeve lining on the zinc container. In some cases, the cases receive a chromate finish by the pouring in and emptying of a mixture of chromic and hydrochloric acid before adding the gelatinous paste. The cathode agglomerate is then placed in position in the centre of the case. A carbon rod is placed centrally in the cathode to act as the current collector.
The zinc cell is then sealed with molten wax or paraffin and heated with a flame to give a better seal. The cells are then welded together to form the battery. The reaction of the battery is:
2 MnO2 + 2 NH4Cl + Zn → ZnCl2 + H2O2 + Mn2O3
Workers may be exposed to manganese dioxide during weighing, mixer loading, grinding, cleaning the oven, sifting, hand pressing and wrapping, depending on the degree of automation, sealed enclosure and local exhaust ventilation. In manual pressing and wet wrapping, there may be exposure to the wet mixture, which can dry to produce inhalable dust; dermatitis may occur from exposure to the slightly corrosive electrolyte. Personal hygiene measures, gloves and respiratory protection for cleaning and maintenance operations, showering facilities and separate lockers for work and street clothes can reduce these risks. As mentioned above, noise hazards can result from the wrapping and tableting press.
Mixing is automatic during manufacture of the gelatinous paste, and the only exposure is during addition of the materials. During addition of mercuric chloride to the gelatinous paste, there is the risk of inhalation and skin absorption and possible mercury poisoning. LEV or personal protective equipment is necessary.
Exposure to spills of chromic acid and hydrochloric acid during chromating and exposure to welding fumes and fumes from heating the sealing compound are also possible. Mechanization of the chromating process, use of gloves and LEV for heat sealing and welding are suitable precautions.
Nickel-Cadmium Batteries
The most common method today of making nickel-cadmium electrodes is by depositing the active electrode material directly into a porous sintered nickel substrate, or plate. (See figure 3.) The plate is prepared by pressing a paste of sintered grade nickel powder (often made by decomposition of nickel carbonyl) into the open grid of nickel-plated perforated sheet steel (or nickel gauze or nickel-plated steel gauze) and then sintering or drying in an oven. These plates may then be cut, weighed and coined (compressed) for particular purposes or rolled into a spiral for household-type cells.
Figure 3. Nickel-cadmium battery production
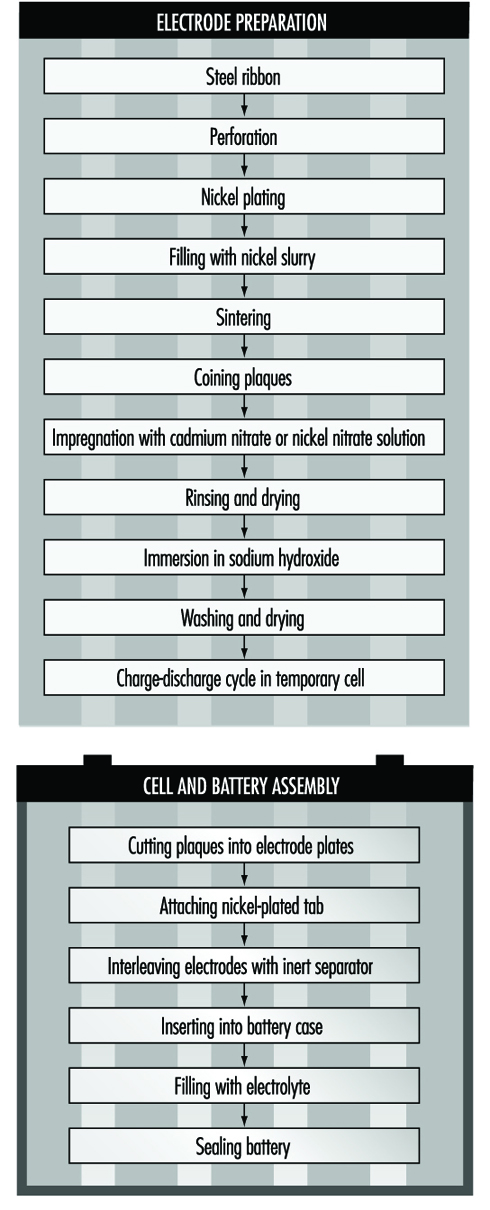
The sintered plaque is then impregnated with nickel nitrate solution for the positive electrode or cadmium nitrate for the negative electrode. These plaques are rinsed and dried, immersed in sodium hydroxide to form nickel hydroxide or cadmium hydroxide and washed and dried again. Usually the next step is to immerse the positive and negative electrodes in a large temporary cell containing 20 to 30% sodium hydroxide. Charge-discharge cycles are run to remove impurities and the electrodes are removed, washed and dried.
An alternative way of making cadmium electrodes is to prepare a paste of cadmium oxide mixed with graphite, iron oxide and paraffin, which is milled and finally compacted between rollers to form the active material. This is then pressed into a moving perforated steel strip that is dried, sometimes compressed, and cut into plates. Lugs may be attached at this stage.
The next steps involve cell and battery assembly. For large batteries, the individual electrodes are then assembled into electrode groups with plates of opposite polarity interleaved with plastic separators. These electrode groups may be bolted or welded together and placed in a nickel-plated steel casing. More recently, plastic battery casings have been introduced. The cells are filled with an electrolyte solution of potassium hydroxide, which may also contain lithium hydroxide. The cells are then assembled into batteries and bolted together. Plastic cells may be cemented or taped together. Each cell is connected with a lead connector to the adjacent cell, leaving a positive and negative terminal at the ends of the battery.
For cylindrical batteries, the impregnated plates are assembled into electrode groups by winding the positive and negative electrodes, separated by an inert material, into a tight cylinder. The electrode cylinder is then placed in a nickel-plated metal case, potassium hydroxide electrolyte is added and the cell is sealed by welding.
The chemical reaction involved in the charging and discharging of nickel-cadmium batteries is:
![]()
The major potential exposure to cadmium occurs from handling of cadmium nitrate and its solution while making paste from cadmium oxide powder and handling the dried active powders. Exposure can also occur during reclamation of cadmium from scrap plates. Enclosure and automated weighing and mixing can reduce these hazards during the early steps.
Similar measures can control exposures to nickel compounds. The production of sintered nickel from nickel carbonyl, although done in sealed machinery, involves potential exposure to extremely toxic nickel carbonyl and carbon monoxide. The process requires continuous monitoring for gas leaks.
The handling of caustic potassium or lithium hydroxide requires suitable ventilation and personal protection. Welding generates fumes and requires LEV.
Health Effects and Disease Patterns
The most serious health hazards in traditional battery making are lead, cadmium, mercury and manganese dioxide exposures. Lead hazards are discussed elsewhere in this chapter and Encyclopaedia. Cadmium can cause kidney disease and is carcinogenic. Cadmium exposure was found to be widespread in US nickel-cadmium battery plants, and many workers have had to be medically removed under the Occupational Safety and Health Administration’s Cadmium Standard provisions due to high cadmium levels in blood and urine (McDiarmid et al. 1996). Mercury affects the kidneys and nervous system. Excessive exposure to mercury vapour has been shown in studies of several mercury battery plants (Telesca 1983). Manganese dioxide exposures have been shown to be high in powder mixing and handling in alkaline dry cell manufacturing (Wallis, Menke and Chelton 1993). This can result in neurofunctional deficits in battery workers (Roels et al. 1992). Manganese dusts can, if absorbed in excessive quantities, lead to disorders of the central nervous system similar to Parkinson’s syndrome. Other metals of concern include nickel, lithium, silver and cobalt.
Skin burns can result from exposure to zinc chloride, potassium hydroxide, sodium hydroxide and lithium hydroxide solutions used in the electrolytes of batteries.
Lead-Acid Battery Manufacture
The first practical design of a lead-acid battery was developed by Gaston Planté in 1860, and production has continued to grow steadily since. Automotive batteries represent the major use of lead-acid technology, followed by industrial batteries (stand-by power and traction). More than half the worldwide production of lead goes into batteries.
The low cost and ease of manufacture of lead-acid batteries in relation to other electrochemical couples should ensure a continuing demand for this system in the future.
The lead-acid battery has a positive electrode of lead peroxide (PbO2) and a negative electrode of high surface area spongy lead (Pb). The electrolyte is a sulphuric acid solution with specific gravity in the range 1.21 to 1.30 (28 to 39% by weight). On discharge, both electrodes convert to lead sulphate, as shown below:
![]()
Manufacturing Process
The manufacturing process, which is shown in the process flow chart (figure 1), is described below:
Figure 1. Lead-acid battery manufacturing process
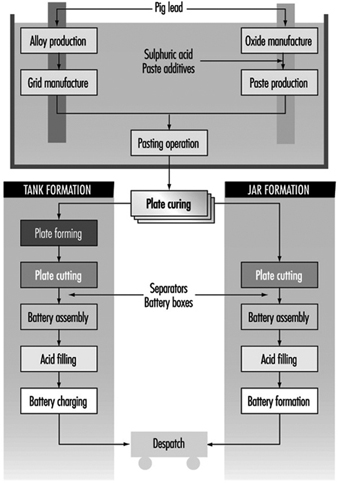
Oxide manufacture: Lead oxide is manufactured from pigs of lead (masses of lead from smelting furnaces) by one of two methods—a Barton Pot or a milling process. In the Barton Pot process, air is blown over molten lead to produce a fine stream of lead droplets. The droplets react with oxygen in the air to form the oxide, which consists of a core of lead with a lead oxide (PbO) coating.
In the milling process, solid lead (which may range in size from small balls to complete pigs) is fed into a rotating mill. The tumbling action of the lead generates heat and the surface of the lead oxidizes. As the particles roll around in the drum, the surface layers of oxide are removed to expose more clean lead for oxidation. The airstream carries the powder to a bag filter, where it is collected.
Grid production: Grids are produced mainly by casting (both automatic and manual) or, particularly for automotive batteries, expansion from wrought or cast lead alloy.
Pasting: Battery paste is made by mixing the oxide with water, sulphuric acid and a range of proprietary additives. The paste is pressed by machine or hand into the grid lattice, and the plates are usually flash-dried in a high-temperature oven.
Pasted plates are cured by storing them in ovens under carefully controlled conditions of temperature, humidity and time. Free lead in the paste converts to lead oxide.
Formation, plate cutting and assembly: Battery plates undergo an electrical formation process in one of two ways. In tank formation, plates are loaded into large baths of dilute sulphuric acid and a direct current is passed to form the positive and negative plates. After drying, the plates are cut and assembled, with separators between them, into battery boxes. Plates of like polarity are connected by welding together the plate lugs.
In jar formation, the plates are electrically formed after being assembled into battery boxes.
Occupational Health Hazards and Controls
Lead
Lead is the major health hazard associated with battery manufacture. The principal exposure route is through inhalation, but ingestion can also pose a problem if insufficient attention is paid to personal hygiene. Exposure can occur at all stages of production.
Lead oxide manufacture is potentially very hazardous. Exposures are controlled by automating the process, thus removing the workers from the hazard. In many factories the process is operated by one person.
In grid casting, exposures to lead fumes are minimized by the use of local exhaust ventilation (LEV) together with thermostatic control of lead pots (lead fume emissions increase markedly above 500 C). Lead-bearing dross, which forms on top of the molten lead, can also cause problems. The dross contains a large amount of very fine dust, and great care has to be exercised when disposing of it.
Pasting areas have traditionally resulted in high lead exposures. The manufacturing method often results in splashes of lead slurry getting onto machinery, the floor, aprons and boots. These splashes dry out and produce airborne lead dust. Control is achieved by keeping the floor permanently wetted and frequently sponging down aprons.
Lead exposures in other departments (forming, plate cutting and assembly) occur through handling dry, dusty plates. Exposures are minimized by LEV together with appropriate use of personal protective equipment.
Many countries have legislation in place to limit the degree of occupational exposure, and numerical standards exist for lead-in-air and blood lead levels.
An occupational health professional is normally employed to take blood samples from exposed workers. The frequency of blood testing can range from annual for low-risk workers to quarterly for those in high-risk departments (e.g., pasting). If a worker’s blood lead level exceeds the statutory limit, then the worker should be removed from any work exposure to lead until the blood lead falls to a level deemed acceptable by the medical adviser.
Air sampling for lead is complementary to blood lead testing. Personal, rather than static, sampling is the preferred method. A large number of lead-in-air samples is usually required because of the inherent variability in results. Use of the correct statistical procedures in analysing the data can give information on sources of lead and can provide a basis for making improvements to engineering design. Regular air sampling can be used to assess the continuing effectiveness of control systems.
The allowable lead-in-air concentrations and blood lead concentrations vary from country to country, and presently range from 0.05 to 0.20 mg/m3 and 50 to 80 mg/dl respectively. There is a continuing downward trend in these limits.
In addition to the normal engineering controls, other measures are necessary to minimize lead exposures. There should be no eating, smoking, drinking or gum chewing in any production area.
Suitable washing and changing facilities should be provided to enable work clothing to be kept in a separate area from personal clothing and footwear. Washing/shower facilities should be located between the clean and dirty areas.
Sulphuric acid
During the formation process the active material on the plates is converted to PbO2 at the positive and Pb at the negative electrode. As the plates become fully charged, the formation current begins to dissociate the water in the electrolyte into hydrogen and oxygen:
Positive: ![]()
Negative: ![]()
Gassing generates sulphuric acid mist. Tooth erosion was, at one time, a common feature among workers in formation areas. Battery companies have traditionally employed the services of a dentist, and many continue to do so.
Recent studies (IARC 1992) have suggested a possible link between exposures to inorganic acid mists (including sulphuric acid) and cancer of the larynx. Research continues in this area.
The occupational exposure standard in the UK for sulphuric acid mist is 1 mg/m3. Exposures can be kept below this level with LEV in place over the formation circuits.
Skin exposure to the corrosive sulphuric acid liquid is also of concern. Precautions include personal protection equipment, eyewash fountains and emergency showers.
Talc
Talc is used in certain hand-casting operations as a mould release agent. Long-term exposure to talc dust can cause pneumoconiosis, and it is important that the dust be controlled by suitable ventilation and process control measures.
Man-made mineral fibres (MMFs)
Separators are used in lead-acid batteries to electrically insulate the positive from the negative plates. Various types of material have been used over the years (e.g., rubber, cellulose, polyvinyl chloride (PVC), polyethylene), but, increasingly, glass fibre separators are being used. These separators are manufactured from MMFs.
An increased risk of lung cancer amongst workers was demonstrated in the early days of the mineral wool industry (HSE 1990). However, this may have been caused by other carcinogenic materials in use at the time. It is prudent nevertheless to ensure that any exposure to MMFs is kept to a minimum by either total enclosure or LEV.
Stibine and arsine
Antimony and arsenic are commonly used in lead alloys, and stibine (SbH3) or arsine (AsH3) can be produced under certain circumstances:
- when a cell is given excessive overcharge
- when dross from a lead calcium alloy is mixed with dross from a lead antimony or lead arsenic alloy. The two drosses can react chemically to form calcium stibide or calcium arsenide which, on subsequent wetting, can generate SbH3 or AsH3.
Stibine and arsine are both highly toxic gases which act by destroying red blood cells. Strict process controls during battery manufacture should prevent any risk of exposure to these gases.
Physical hazards
A variety of physical hazards also exists in battery manufacturing (e.g., noise, molten metal and acid splashes, electrical hazards and manual handling), but the risks from these can be reduced by appropriate engineering and process controls.
Environmental Issues
The effect of lead on the health of children has been extensively studied. It is therefore very important that environmental releases of lead be kept to a minimum. For battery factories, the most polluting air emissions should be filtered. All process waste (usually an acidic lead-bearing slurry) should be processed at an effluent treatment plant to neutralize the acid and settle out the lead from the suspension.
Future Developments
It is likely that there will be increasing restrictions on the use of lead in the future. In an occupational sense this will result in increasing automation of processes so that the worker is removed from the hazard.
General Profile
Overview of the Sector
Electrical equipment includes a wide-ranging field of devices. It would be impossible to include information on all items of equipment, and this chapter will therefore be limited to coverage of products of some of the major industries. Numerous processes are involved in the manufacture of such equipment. This chapter discusses the hazards likely to be encountered by persons working in the manufacture of batteries, electric cables, electric lamps and general domestic electrical equipment. It concentrates upon electrical equipment; electronic equipment is discussed in detail in the chapter Microelectronics and semiconductors.
Evolution of the Industry
The pioneering discovery of electromagnetic induction was instrumental in the development of today’s vast electrical industry. The discovery of the electrochemical effect led to the development of batteries as a means of supplying electrical equipment from portable power sources using direct current systems. As devices which relied upon power from mains were invented, a system of transmission and distribution of electricity was required, which led to the introduction of flexible electrical conductors (cables).
The early forms of artificial lighting (i.e., carbon arc and gas lighting) were superseded by the filament lamp (originally with a carbon filament, exhibited by Joseph Swan in England in January 1879). The filament lamp was to enjoy an unprecedented monopoly in domestic, commercial and industrial applications prior to the outbreak of the Second World War, at which stage the fluorescent lamp was introduced. Other forms of discharge lighting, all of which depend upon the passage of an electric current through a gas or vapour, have subsequently been developed and have a variety of applications in commerce and industry.
Other electrical appliances in many fields (e.g., audio-visual, heating, cooking and refrigeration) are constantly being developed, and the range of such devices is increasing. This is typified by the introduction of satellite television and the microwave cooker.
While the availability and accessibility of raw materials had a significant effect upon the development of the industries, the locations of the industries were not necessarily determined by the locations of the raw material sources. The raw materials are often processed by a third party before being used in the assembly of electrical appliances and equipment.
Characteristics of the Workforce
The skills and expertise possessed by those who work in the industry now are different from those possessed by the workforce in earlier years. Equipment used in the production and manufacture of batteries, cables, lamps and domestic electrical appliances is highly automated.
In many instances those who are currently involved in the industry require specialized training in order to carry out their work. Teamwork is a significant factor in the industry, since many processes involve production line systems, where the work of individuals depends upon the work of others.
An ever-increasing number of manufacturing processes involved in the production of electrical appliances rely on some form of computerization. It is necessary, therefore, for the workforce to be familiar with computer techniques. This may not present any problems to the younger workforce, but older workers may not have had any previous computer experience, and it is likely that they will need to be re-trained.
Economic Importance of the Industry
Some countries benefit more than others from the electrical appliances and equipment industry. The industry has economic importance for those countries from which raw materials are obtained and those in which the end products are assembled and/or constructed. Assembly and construction take place in many different countries.
Raw materials do not have infinite availability. Discarded equipment should be re-used wherever possible. However, the costs involved in recovering those parts of discarded equipment which may be re-used may ultimately be prohibitive.
Static Electric and Magnetic Fields
Both our natural and our artificial environments generate electric and magnetic forces of various magnitudes—in the outdoors, in offices, in households and in industrial workplaces. This raises two important questions: (1) do these exposures pose any adverse human health effects, and (2) what limits can be set in an attempt to define “safe” limits of such exposures?
This discussion focuses on static electric and magnetic fields. Studies are described on workers in various industries, and also on animals, which fail to demonstrate any clear-cut adverse biological effects at the levels of exposure to electric and magnetic fields usually encountered. Nevertheless, attempts are made to discuss the efforts of a number of international organizations to set guidelines to protect workers and others from any possible dangerous level of exposure.
Definition of Terms
When a voltage or electric current is applied to an object such as an electrical conductor, the conductor becomes charged and forces start to act on other charges in the vicinity. Two types of forces may be distinguished: those arising from stationary electric charges, known as the electrostatic force, and those appearing only when charges are moving (as in an electric current in a conductor), known as the magnetic force. To describe the existence and spatial distribution of these forces, physicists and mathematicians have created the concept of field. One thus speaks of a field of force, or simply, electric and magnetic fields.
The term static describes a situation where all charges are fixed in space, or move as a steady flow. As a result, both charges and current densities are constant in time. In the case of fixed charges, we have an electric field whose strength at any point in space depends on the value and geometry of all the charges. In the case of steady current in a circuit, we have both an electric and a magnetic field constant in time (static fields), since the charge density at any point of the circuit does not vary.
Electricity and magnetism are distinct phenomena as long as charges and current are static; any interconnection between electric and magnetic fields disappears in this static situation and thus they can be treated separately (unlike the situation in time-varying fields). Static electric and magnetic fields are clearly characterized by steady, time-independent strengths and correspond to the zero-frequency limit of the extremely low frequency (ELF) band.
Static Electric Fields
Natural and occupational exposure
Static electric fields are produced by electrically charged bodies where an electric charge is induced on the surface of an object within a static electric field. As a consequence, the electric field at the surface of an object, particularly where the radius is small, such as at a point, can be larger than the unperturbed electric field (that is, the field without the object present). The field inside the object may be very small or zero. Electric fields are experienced as a force by electrically charged objects; for example, a force will be exerted on body hair, which may be perceived by the individual.
On the average, the surface charge of the earth is negative while the upper atmosphere carries a positive charge. The resulting static electric field near the earth’s surface has a strength of about 130 V/m. This field decreases with height, and its value is about 100 V/m at 100 m elevation, 45 V/m at 1 km, and less than 1 V/m at 20 km. Actual values vary widely, depending upon the local temperature and humidity profile and the presence of ionized contaminants. Beneath thunderclouds, for example, and even as thunderclouds are approaching, large field variations occur at ground level, because normally the lower part of a cloud is negatively charged while the upper part contains a positive charge. In addition, there is a space charge between the cloud and ground. As the cloud approaches, the field at ground level may first increase and then reverse, with the ground becoming positively charged. During this process, fields of 100 V/m to 3 kV/m may be observed even in the absence of local lightning; field reversals may take place very rapidly, within 1 min, and high field strengths may persist for the duration of the storm. Ordinary clouds, as well as thunderclouds, contain electric charges and therefore deeply affect the electric field at ground level. Large deviations from the fair-weather field, up to 200%, are also to be expected in the presence of fog, rain and naturally occurring small and large ions. Electric field changes during the daily cycle can even be expected in completely fair weather: fairly regular changes in local ionization, temperature or humidity and the resulting changes in the atmospheric electrical conductivity near the ground, as well as mechanical charge transfer by local air movements, are probably responsible for these diurnal variations.
Typical levels of man-made electrostatic fields are in the 1 to 20 kV/m range in offices and households; these fields are frequently generated around high-voltage equipment, such as TV sets and video display units (VDUs), or by friction. Direct current (DC) transmission lines generate both static electric and magnetic fields and are an economical means of power distribution where long distances are involved.
Static electric fields are widely used in industries such as chemicals, textile, aviation, paper and rubber, and in transportation.
Biological effects
Experimental studies provide little biological evidence to suggest any adverse effect of static electric fields on human health. The few animal studies that have been carried out also appear to have yielded no data supporting adverse effects on genetics, tumour growth, or on the endocrine or cardiovascular systems. (Table 1 summarizes these animal studies.)
Table 1. Studies on animals exposed to static electric fields
|
Biological end-points |
Reported effects |
Exposure conditions |
|
Haematology and immunology |
Changes in the albumin and globulin fractions of serum proteins in rats. No significant differences in blood cell counts, blood proteins or blood |
Continuous exposure to fields between 2.8 and 19.7 kV/m Exposure to 340 kV/m for 22 h/day for a total of 5,000 h |
|
Nervous system |
Induction of significant changes observed in the EEGs of rats. However, no clear indication of a consistent response No significant changes in the concentrations and utilization rates of |
Exposure to electric field strengths up to 10 kV/m Exposure to a 3 kV/m field for up to 66 h |
|
Behaviour |
Recent, well-conducted studies suggesting no effect on rodent Production of dose-dependent avoidance behaviour in male rats, with no influence of air ions |
Exposure to field strengths up to 12 kV/m Exposure to HVD electric fields ranging from 55 to 80 kV/m |
|
Reproduction and development |
No significant differences in the total number of offspring nor in the |
Exposure to 340 kV/m for 22 h/day before, during and after |
No in vitro studies have been conducted to evaluate the effect of exposing cells to static electric fields.
Theoretical calculations suggest that a static electric field will induce a charge on the surface of exposed people, which may be perceived if discharged to a grounded object. At a sufficiently high voltage, the air will ionize and become capable of conducting an electric current between, for example, a charged object and a grounded person. The breakdown voltage depends on a number of factors, including the shape of the charged object and atmospheric conditions. Typical values of corresponding electric field strengths range between 500 and 1,200 kV/m.
Reports from some countries indicate that a number of VDU operators have experienced skin disorders, but the exact relationship of these to VDU work is unclear. Static electric fields at VDU workplaces have been suggested as a possible cause of these skin disorders, and it is possible that the electrostatic charge of the operator may be a relevant factor. However, any relationship between electrostatic fields and skin disorders must still be regarded as hypothetical based on available research evidence.
Measurements, prevention, exposure standards
Static electric field strength measurements may be reduced to measurements of voltages or electric charges. Several electrostatic voltmeters are commercially available which permit accurate measurements of electrostatic or other high-impedance sources without physical contact. Some utilize an electrostatic chopper for low drift, and negative feedback for accuracy and probe-to-surface spacing insensitivity. In some cases the electrostatic electrode “looks” at the surface under measurement through a small hole at the base of the probe assembly. The chopped AC signal induced on this electrode is proportional to the differential voltage between the surface under measurement and the probe assembly. Gradient adapters are also used as accessories to electrostatic voltmeters, and permit their use as electrostatic field strength meters; direct readout in volts per metre of separation between the surface under test and the grounded plate of the adapter is possible.
There are no good data which can serve as guidelines to set base limits of human exposure to static electric fields. In principle, an exposure limit could be derived from the minimum breakdown voltage for air; however, the field strength experienced by a person within a static electric field will vary according to body orientation and shape, and this must be taken into account in attempting to arrive at an appropriate limit.
Threshold limit values (TLVs) have been recommended by the American Conference of Governmental Industrial Hygienists (ACGIH 1995). These TLVs refer to the maximum unprotected workplace static electric field strength, representing conditions under which nearly all workers may be exposed repeatedly without adverse health effects. According to ACGIH, occupational exposures should not exceed a static electric field strength of 25 kV/m. This value should be used as a guide in the control of exposure and, due to individual susceptibility, should not be regarded as a clear line between safe and dangerous levels. (This limit refers to the field strength present in air, away from the surfaces of conductors, where spark discharges and contact currents may pose significant hazards, and is intended for both partial-body and whole-body exposures.) Care should be taken to eliminate ungrounded objects, to ground such objects, or to use insulated gloves when ungrounded objects must be handled. Prudence dictates the use of protective devices (e.g., suits, gloves and insulation) in all fields exceeding 15 kV/m.
According to ACGIH, present information on human responses and possible health effects of static electric fields is insufficient to establish a reliable TLV for time-weighted average exposures. It is recommended that, lacking specific information from the manufacturer on electromagnetic interference, the exposure of wearers of pacemakers and other medical electronic devices should be maintained at or below 1 kV/m.
In Germany, according to a DIN Standard, occupational exposures should not exceed a static electric field strength of 40 kV/m. For short exposures (up to two hours per day) a higher limit of 60 kV/m is permitted.
In 1993, the National Radiological Protection Board (NRPB 1993) provided advice concerning appropriate restrictions on the exposure of people to electromagnetic fields and radiation. This includes both static electric and magnetic fields. In the NRPB document, investigation levels are provided for the purpose of comparing values of measured field quantities in order to determine whether or not compliance with basic restrictions has been achieved. If the field to which a person is exposed exceeds the relevant investigation level, compliance with the basic restrictions must be checked. Factors that might be considered in such an assessment include, for example, the efficiency of the coupling of the person to the field, the spatial distribution of the field across the volume occupied by the person, and the duration of exposure.
According to NRPB it is not possible to recommend basic restrictions for avoiding direct effects of human exposure to static electric fields; guidance is given to avoid annoying effects of direct perception of the surface electric charge and indirect effects such as electric shock. For most people, the annoying perception of surface electric charge, acting directly on the body, will not occur during exposure to static electric field strengths less than about 25 kV/m, that is, the same field strength recommended by ACGIH. To avoid spark discharges (indirect effects) causing stress, NRPB recommends that DC contact currents be restricted to less than 2 mA. Electric shock from low impedance sources can be prevented by following established electrical safety procedures relevant to such equipment.
Static Magnetic Fields
Natural and occupational exposure
The body is relatively transparent to static magnetic fields; such fields will interact directly with magnetically anisotropic materials (exhibiting properties with different values when measured along axes in different directions) and moving charges.
The natural magnetic field is the sum of an internal field due to the earth acting as a permanent magnet and an external field generated in the environment from such factors as solar activity or atmospherics. The internal magnetic field of the earth originates from the electric current flowing in the upper layer of the earth’s core. There are significant local differences in the strength of this field, whose average magnitude varies from about 28 A/m at the equator (corresponding to a magnetic flux density of about 35 mT in a non-magnetic material such as air) to about 56 A/m over the geomagnetic poles (corresponding to about 70 mT in air).
Artificial fields are stronger than those of natural origin by many orders of magnitude. Artificial sources of static magnetic fields include all devices containing wires carrying direct current, including many appliances and equipment in industry.
In direct-current power transmission lines, static magnetic fields are produced by moving charges (an electric current) in a two-wire line. For an overhead line, the magnetic flux density at ground level is about 20 mT for a 500 kV line. For an underground transmission line buried at 1.4 m and carrying a maximum current of about 1 kA, the maximum magnetic flux density is less than 10 mT at ground level.
Major technologies that involve the use of large static magnetic fields are listed in table 2 along with their corresponding exposure levels.
Table 2. Major technologies involving the use of large static magnetic fields, and corresponding exposure levels
|
Procedures |
Exposure levels |
|
Energy technologies |
|
|
Thermonuclear fusion reactors |
Fringe fields up to 50 mT in areas accessible to personnel. |
|
Magnetohydrodynamic systems |
Approximately 10 mT at about 50 m; 100 mT only at distances greater than 250 m |
|
Superconducting magnet energy storage systems |
Fringe fields up to 50 mT at operator-accessible locations |
|
Superconducting generators and transmission lines |
Fringe fields projected to be less than 100 mT |
|
Research facilities |
|
|
Bubble chambers |
During changes of film cassettes, the field is about 0.4–0.5 T at foot level and about 50 mT at the level of the head |
|
Superconducting spectrometers |
About 1 T at operator-accessible locations |
|
Particle accelerators |
Personnel are seldom exposed because of exclusion from the high radiation zone. Exceptions arise only during maintenance |
|
Isotope separation units |
Brief exposures to fields up to 50 mT |
|
Industry |
|
|
Aluminium production |
Levels up to 100 mT in operator-accessible locations |
|
Electrolytic processes |
Mean and maximum field levels of about 10 and 50 mT, respectively |
|
Production of magnets |
2–5 mT at worker’s hands; in the range of 300 to 500 mT at the level of the chest and head |
|
Medicine |
|
|
Nuclear magnetic resonance imaging and spectroscopy |
An unshielded 1-T magnet produces about 0.5 mT at 10 m, and an unshielded 2-T magnet produces the same exposure at about 13 m |
Biological effects
Evidence from experiments with laboratory animals indicates that there are no significant effects on the many developmental, behavioural, and physiological factors evaluated at static magnetic flux densities up to 2 T. Nor have studies on mice demonstrated any harm to the foetus from exposure to magnetic fields up to 1 T.
Theoretically, magnetic effects could retard blood flowing in a strong magnetic field and produce a rise in blood pressure. A flow reduction of at most a few per cent could be expected at 5 T, but none was observed in human subjects at 1.5 T, when investigated.
Some studies on workers involved in the manufacture of permanent magnets have reported various subjective symptoms and functional disturbances: irritability, fatigue, headache, loss of appetite, bradycardia (slow heart beat), tachycardia (rapid heart beat), decreased blood pressure, altered EEG, itching, burning and numbness. However, lack of any statistical analysis or assessment of the impact of physical or chemical hazards in the working environment significantly reduces the validity of these reports and makes them difficult to evaluate. Although the studies are inconclusive, they do suggest that, if long-term effects do in fact occur, they are very subtle; no cumulative gross effects have been reported.
Individuals exposed to a 4T magnetic flux density have been reported as experiencing sensory effects associated with motion in the field, such as vertigo (dizziness), feeling of nausea, a metallic taste, and magnetic sensations when moving the eyes or head. However, two epidemiological surveys of general health data in workers chronically exposed to static magnetic fields failed to reveal any significant health effects. Health data of 320 workers were obtained in plants using large electrolytic cells for chemical separation processes where the average static field level in the work environment was 7.6 mT and the maximum field was 14.6 mT. Slight changes in the white blood cell count, but still within the normal range, were detected in the exposed group compared to the 186 controls. None of the observed transient changes in blood pressure or other blood measurements was considered indicative of a significant adverse effect associated with magnetic field exposure. In another study, the prevalence of disease was evaluated among 792 workers who were occupationally exposed to static magnetic fields. The control group consisted of 792 unexposed workers matched for age, race and socio-economic status. The range of magnetic field exposures varied from 0.5 mT for long durations to 2 T for periods of several hours. No statistically significant change in the prevalence of 19 categories of disease was observed in the exposed group compared with the controls. No difference in the prevalence of disease was found between a subgroup of 198 who had experienced exposures of 0.3 T or higher for periods of one hour or longer when compared with the remainder of the exposed population or the matched controls.
A report on workers in the aluminium industry indicated an elevated leukaemia mortality rate. Although this epidemiological study reported an increased cancer risk for persons directly involved in aluminium production where workers are exposed to large static magnetic fields, there is at present no clear evidence to indicate exactly which carcinogenic factors within the work environment are responsible. The process used for aluminium reduction creates coal tar, pitch volatiles, fluoride fumes, sulphur oxides and carbon dioxide, and some of these might be more likely candidates for cancer-causing effects than magnetic field exposure.
In a study on French aluminium workers, cancer mortality and mortality from all causes were found not to differ significantly from that observed for the general male population of France (Mur et al. 1987).
Another negative finding linking magnetic field exposures to possible cancer outcomes comes from a study of a group of workers at a chloroalkali plant where the 100 kA DC currents used for the electrolytic production of chlorine gave rise to static magnetic flux densities, at worker’s locations, ranging from 4 to 29 mT. The observed versus expected incidence of cancer among these workers over a 25-year period showed no significant differences.
Measurements, prevention and exposure standards
During the last thirty years, the measurement of magnetic fields has undergone considerable development. Progress in techniques has made it possible to develop new methods of measurement as well as to improve old ones.
The two most popular types of magnetic field probes are a shielded coil and a Hall probe. Most of the commercially available magnetic field meters use one of them. Recently, other semiconductor devices, namely bipolar transistors and FET transistors, have been proposed as magnetic field sensors. They offer some advantages over Hall probes, such as higher sensitivity, greater spatial resolution and broader frequency response.
The principle of the nuclear magnetic resonance (NMR) measurement technique is to determine the resonant frequency of the test specimen in the magnetic field to be measured. It is an absolute measurement that can be made with very great accuracy. The measuring range of this method is from about 10 mT to 10 T, with no definite limits. In field measurements using the proton magnetic resonance method, an accuracy of 10–4 is easily obtained with simple apparatus and an accuracy of 10–6 can be reached with extensive precautions and refined equipment. The inherent shortcoming of the NMR method is its limitation to a field with a low gradient and the lack of information about the field direction.
Recently, several personal dosimeters suitable for monitoring exposures to static magnetic fields have also been developed.
Protective measures for the industrial and scientific use of magnetic fields can be categorized as engineering design measures, the use of separation distance, and administrative controls. Another general category of hazard-control measures, which include personal protective equipment (e.g., special garments and face masks), does not exist for magnetic fields. However, protective measures against potential hazards from magnetic interference with emergency or medical electronic equipment and for surgical and dental implants are a special area of concern. The mechanical forces imparted to ferromagnetic (iron) implants and loose objects in high-field facilities require that precautions be taken to guard against health and safety hazards.
Techniques to minimize undue exposure to high-intensity magnetic fields around large research and industrial facilities generally fall into four types:
- distance and time
- magnetic shielding
- electromagnetic interference (EMI) and compatibility
- administrative measures.
The use of warning signs and special-access areas to limit exposure of personnel near large magnet facilities has been of greatest use for controlling exposure. Administrative controls such as these are generally preferable to magnetic shielding, which can be extremely expensive. Loose ferromagnetic and paramagnetic (any magnetizing substances) objects can be converted into dangerous missiles when subjected to intense magnetic field gradients. Avoidance of this hazard can be achieved only by removing loose metallic objects from the area and from personnel. Such items as scissors, nail files, screwdrivers and scalpels should be banned from the immediate vicinity.
The earliest static magnetic field guidelines were developed as an unofficial recommendation in the former Soviet Union. Clinical investigations formed the basis for this standard, which suggested that the static magnetic field strength at the workplace should not exceed 8 kA/m (10 mT).
The American Conference of Governmental Industrial Hygienists issued TLVs of static magnetic flux densities that most workers could be exposed to repeatedly, day after day, without adverse health effects. As for electric fields, these values should be used as guides in the control of exposure to static magnetic fields, but they should not be regarded as a sharp line between safe and dangerous levels. According to ACGIH, routine occupational exposures should not exceed 60 mT averaged over the whole body or 600 mT to the extremities on a daily, time-weighted basis. A flux density of 2 T is recommended as a ceiling value. Safety hazards may exist from the mechanical forces exerted by the magnetic field upon ferromagnetic tools and medical implants.
In 1994, the International Commission on Non-Ionizing Radiation Protection (ICNIRP 1994) finalized and published guidelines on limits of exposure to static magnetic fields. In these guidelines, a distinction is made between exposure limits for workers and the general public. The limits recommended by the ICNIRP for occupational and general public exposures to static magnetic fields are summarized in table 3. When magnetic flux densities exceed 3 mT, precautions should be taken to prevent hazards from flying metallic objects. Analogue watches, credit cards, magnetic tapes and computer disks may be adversely affected by exposure to 1 mT, but this is not seen as a safety concern for people.
Table 3. Limits of exposure to static magnetic fields recommended by the International Commission on Non-Ionizing Radiation Protection (ICNIRP)
|
Exposure characteristics |
Magnetic flux density |
|
Occupational |
|
|
Whole working day (time-weighted average) |
200 mT |
|
Ceiling value |
2 T |
|
Limbs |
5 T |
|
General Public |
|
|
Continuous exposure |
40 mT |
Occasional access of the public to special facilities where magnetic flux densities exceed 40 mT can be allowed under appropriately controlled conditions, provided that the appropriate occupational exposure limit is not exceeded.
ICNIRP exposure limits have been set for a homogeneous field. For inhomogeneous fields (variations within the field), the average magnetic flux density must be measured over an area of 100 cm2.
According to a recent NRPB document, the restriction on acute exposure to less than 2 T will avoid acute responses such as vertigo or nausea and adverse health effects resulting from cardiac arrhythmia (irregular heart beat) or impaired mental function. In spite of the relative lack of evidence from studies of exposed populations regarding possible long-term effects of high fields, the Board considers it advisable to restrict long-term, time-weighted exposure over 24 hours to less than 200 mT (one-tenth of that intended to prevent acute responses). These levels are quite similar to those recommended by ICNIRP; ACGIH TLVs are slightly lower.
People with cardiac pacemakers and other electrically activated implanted devices, or with ferromagnetic implants, may not be adequately protected by the limits given here. The majority of cardiac pacemakers are unlikely to be affected from exposure to fields below 0.5 mT. People with some ferromagnetic implants or electrically activated devices (other than cardiac pacemakers) may be affected by fields above a few mT.
Other sets of guidelines recommending limits of occupational exposure exist: three of these are enforced in high-energy physics laboratories (Stanford Linear Accelerator Center and Lawrence Livermore National Laboratory in California, CERN accelerator laboratory in Geneva), and an interim guideline at the US Department of Energy (DOE).
In Germany, according to a DIN Standard, occupational exposures should not exceed a static magnetic field strength of 60 kA/m (about 75 mT). When only the extremities are exposed, this limit is set at 600 kA/m; field strength limits up to 150 kA/m are permitted for short, whole-body exposures (up to 5 min per hour).
VLF and ELF Electric and Magnetic Fields
Extremely low frequency (ELF) and very low frequency (VLF) electric and magnetic fields encompass the frequency range above static (> 0 Hz) fields up to 30 kHz. For this paper ELF is defined as being in the frequency range > 0 to 300 Hz and VLF in the range > 300 Hz to 30 kHz. In the frequency range > 0 to 30 kHz, the wavelengths vary from ∞(infinity) to 10 km and so the electric and magnetic fields act essentially independently of each other and must be treated separately. The electric field strength (E) is measured in volts per metre (V/m), the magnetic field strength (H) is measured in amperes per metre (A/m) and the magnetic flux density (B) in tesla (T).
Considerable debate about possible adverse health effects has been expressed by workers using equipment that operates in this frequency range. By far the most common frequency is 50/60 Hz, used for the generation, distribution and use of electric power. Concerns that exposure to 50/60 Hz magnetic fields may be associated with an increased cancer incidence have been fuelled by media reports, distribution of misinformation and ongoing scientific debate (Repacholi 1990; NRC 1996).
The purpose of this article is to provide an overview of the following topic areas:
- sources, occupations and applications
- dosimetry and measurement
- interaction mechanisms and biological effects
- human studies and effects on health
- protective measures
- occupational exposure standards.
Summary descriptions are provided to inform workers of the types and strengths of fields from major sources of ELF and VLF, biological effects, possible health consequences and current exposure limits. An outline of safety precautions and protective measures is also given. While many workers use visual display units (VDUs), only brief details are given in this article since they are covered in greater detail elsewhere in the Encyclopaedia.
Much of the material contained here can be found in greater detail in a number of recent reviews (WHO 1984, 1987, 1989, 1993; IRPA 1990; ILO 1993; NRPB 1992, 1993; IEEE 1991; Greene 1992; NRC 1996).
Sources of Occupational Exposure
Levels of occupational exposure vary considerably and are strongly dependent upon the particular application. Table 1 gives a summary of typical applications of frequencies in the range > 0 to 30 kHz.
Table 1. Applications of equipment operating in the range > 0 to 30 kHz
|
Frequency |
Wavelength(km) |
Typical applications |
|
16.67, 50, 60 Hz |
18,000–5,000 |
Power generation, transmissions and use, electrolytic processes, induction heating, arc and ladle furnaces, welding, transportation, etc., any industrial, commercial, medical or research use of electric power |
|
0.3–3 kHz |
1,000–100 |
Broadcast modulation, medical applications, electric furnaces, induction heating, hardening, soldering, melting, refining |
|
3–30 kHz |
100–10 |
Very long-range communications, radio navigation, broadcast modulation, medical applications, induction heating, hardening, soldering, melting, refining, VDUs |
Power generation and distribution
The principal artificial sources of 50/60 Hz electric and magnetic fields are those involved in power generation and distribution, and any equipment using electric current. Most such equipment operates at the power frequencies of 50 Hz in most countries and 60 Hz in North America. Some electric train systems operate at 16.67 Hz.
High voltage (HV) transmission lines and substations have associated with them the strongest electric fields to which workers may be routinely exposed. Conductor height, geometrical configuration, lateral distance from the line, and the voltage of the transmission line are by far the most significant factors in considering the maximum electric field strength at ground level. At lateral distances of about twice the line height, the electric field strength decreases with distance in an approximately linear fashion (Zaffanella and Deno 1978). Inside buildings near HV transmission lines, the electric field strengths are typically lower than the unperturbed field by a factor of about 100,000, depending on the configuration of the building and the structural materials.
Magnetic field strengths from overhead transmission lines are usually relatively low compared to industrial applications involving high currents. Electrical utility employees working in substations or on the maintenance of live transmission lines form a special group exposed to larger fields (of 5 mT and higher in some cases). In the absence of ferromagnetic materials, the magnetic field lines form concentric circles around the conductor. Apart from the geometry of the power conductor, the maximum magnetic flux density is determined only by the magnitude of the current. The magnetic field beneath HV transmission lines is directed mainly transverse to the line axis. The maximum flux density at ground level may be under the centre line or under the outer conductors, depending on the phase relationship between the conductors. The maximum magnetic flux density at ground level for a typical double circuit 500 kV overhead transmission lines system is approximately 35 μT per kiloampere of current transmitted (Bernhardt and Matthes 1992). Typical values for the magnetic flux density up to 0.05 mT occur in workplaces near overhead lines, in substations and in power stations operating at frequencies of 16 2/3, 50, or 60 Hz (Krause 1986).
Industrial processes
Occupational exposure to magnetic fields comes predominantly from working near industrial equipment using high currents. Such devices include those used in welding, electroslag refining, heating (furnaces, induction heaters) and stirring.
Surveys on induction heaters used in industry, performed in Canada (Stuchly and Lecuyer 1985), in Poland (Aniolczyk 1981), in Australia (Repacholi, unpublished data) and in Sweden (Lövsund, Oberg and Nilsson 1982), show magnetic flux densities at operator locations ranging from 0.7 μT to 6 mT, depending on the frequency used and the distance from the machine. In their study of magnetic fields from industrial electro-steel and welding equipment, Lövsund, Oberg and Nilsson (1982) found that spot-welding machines (50 Hz, 15 to 106 kA) and ladle furnaces (50 Hz, 13 to 15 kA) produced fields up to 10 mT at distances up to 1 m. In Australia, an induction heating plant operating in the range 50 Hz to 10 kHz was found to give maximum fields of up to 2.5 mT (50 Hz induction furnaces) at positions where operators could stand. In addition maximum fields around induction heaters operating at other frequencies were 130 μT at 1.8 kHz, 25 μT at 2.8 kHz and in excess of 130 μT at 9.8 kHz.
Since the dimensions of coils producing the magnetic fields are often small there is seldom high exposure to the whole body, but rather local exposure mainly to the hands. Magnetic flux density to the hands of the operator may reach 25 mT (Lövsund and Mild 1978; Stuchly and Lecuyer 1985). In most cases the flux density is less than 1 mT. The electric field strength near the induction heater is usually low.
Workers in the electrochemical industry may be exposed to high electric and magnetic field strengths because of electrical furnaces or other devices using high currents. For instance, near induction furnaces and industrial electrolytic cells magnetic flux densities can be measured as high as 50 mT.
Visual display units
The use of visual display units (VDUs) or video display terminals (VDTs) as they are also called, grows at an ever increasing rate. VDT operators have expressed concerns about possible effects from emissions of low-level radiations. Magnetic fields (frequency 15 to 125 kHz) as high as 0.69 A/m (0.9 μT) have been measured under worst-case conditions close to the surface of the screen (Bureau of Radiological Health 1981). This result has been confirmed by many surveys (Roy et al. 1984; Repacholi 1985 IRPA 1988). Comprehensive reviews of measurements and surveys of VDTs by national agencies and individual experts concluded that there are no radiation emissions from VDTs that would have any consequences for health (Repacholi 1985; IRPA 1988; ILO 1993a). There is no need to perform routine radiation measurements since, even under worst-case or failure mode conditions, the emission levels are well below the limits of any international or national standards (IRPA 1988).
A comprehensive review of emissions, summary of the applicable scientific literature, standards and guidelines has been provided in the document (ILO 1993a).
Medical applications
Patients suffering from bone fractures that do not heal well or unite have been treated with pulsed magnetic fields (Bassett, Mitchell and Gaston 1982; Mitbreit and Manyachin 1984). Studies are also being conducted on the use of pulsed magnetic fields to enhance wound healing and tissue regeneration.
Various devices generating magnetic field pulses are used for bone growth stimulation. A typical example is the device that generates an average magnetic flux density of about 0.3 mT, a peak strength of about 2.5 mT, and induces peak electric field strengths in the bone in the range of 0.075 to 0.175 V/m (Bassett, Pawluk and Pilla 1974). Near the surface of the exposed limb, the device produces a peak magnetic flux density of the order of 1.0 mT causing peak ionic current densities of about 10 to 100 mA/m2 (1 to 10 μA/cm2) in tissue.
Measurement
Prior to the commencement of measurements of ELF or VLF fields, it is important to obtain as much information as possible about the characteristics of the source and the exposure situation. This information is required for the estimation of the expected field strengths and the selection of the most appropriate survey instrumentation (Tell 1983).
Information about the source should include:
- frequencies present, including harmonics
- power transmitted
- polarization (orientation of E field)
- modulation characteristics (peak and average values)
- duty cycle, pulse width, and pulse repetition frequency
- antenna characteristics, such as type, gain, beam width and scan rate.
Information about the exposure situation must include:
- distance from the source
- existence of any scattering objects. Scattering by plane surfaces can enhance the E field by a factor of 2. Even greater enhancement may result from curved surfaces, e.g., corner reflectors.
Results of surveys conducted in occupational settings are summarized in table 2.
Table 2. Occupational sources of exposure to magnetic fields
|
Source |
Magnetic flux |
Distance (m) |
|
VDTs |
Up to 2.8 x 10⁻⁴ |
0.3 |
|
HV lines |
Up to 0.4 |
under line |
|
Power stations |
Up to 0.27 |
1 |
|
Welding arcs (0–50 Hz) |
0.1–5.8 |
0–0.8 |
|
Induction heaters (50–10 kHz) |
0.9–65 |
0.1–1 |
|
50 Hz Ladle furnace |
0.2–8 |
0.5–1 |
|
50 Hz Arc furnace |
Up to 1 |
2 |
|
10 Hz Induction stirrer |
0.2–0.3 |
2 |
|
50 Hz Electroslag welding |
0.5–1.7 |
0.2–0.9 |
|
Therapeutic equipment |
1–16 |
1 |
Source: Allen 1991; Bernhardt 1988; Krause 1986; Lövsund, Oberg and Nilsson 1982; Repacholi, unpublished data; Stuchly 1986; Stuchly and Lecuyer 1985, 1989.
Instrumentation
An electric or magnetic field-measuring instrument consists of three basic parts: the probe, the leads and the monitor. To ensure appropriate measurements, the following instrumentation characteristics are required or are desirable:
- The probe must respond only to the E field or the H field and not to both simultaneously.
- The probe must not produce significant perturbation of the field.
- The leads from the probe to the monitor must not disturb the field at the probe significantly, or couple energy from the field.
- The frequency response of the probe must cover the range of frequencies required to be measured.
- If used in the reactive near-field, the dimensions of the probe sensor should preferably be less than a quarter of a wavelength at the highest frequency present.
- The instrument should indicate the root mean square (rms) value of the measured field parameter.
- The response time of the instrument should be known. It is desirable to have a response time of about 1 second or less, so that intermittent fields are easily detected.
- The probe should be responsive to all polarization components of the field. This may be accomplished either by inherent isotropic response, or by physical rotation of the probe through three orthogonal directions.
- Good overload protection, battery operation, portability and rugged construction are other desirable characteristics.
- Instruments provide an indication of one or more of the following parameters: average E field (V/m) or mean square E field (V2/m2); average H field (A/m) or mean square H field (A2/m2).
Surveys
Surveys are usually conducted to determine whether fields existing in the workplace are below limits set by national standards. Thus the person taking the measurements must be fully familiar with these standards.
All occupied and accessible locations should be surveyed. The operator of the equipment under test and the surveyor should be as far away as practicable from the test area. All objects normally present, which may reflect or absorb energy, must be in position. The surveyor should take precautions against radiofrequency (RF) burns and shock, particularly near high-power, low-frequency systems.
Interaction Mechanisms and Biological Effects
Interaction mechanisms
The only established mechanisms by which ELF and VLF fields interact with biological systems are:
- Electric fields which induce a surface charge on an exposed body which results in currents (measured in mA/m2) inside the body, the magnitude of which is related to the surface charge density. Depending on the exposure conditions, size, shape and position of the exposed body in the field, the surface charge density can vary greatly, resulting in a variable and non-uniform distribution of currents inside the body.
- Magnetic fields also act on humans by inducing electric fields and currents inside the body.
- Electric charges induced in a conducting object (e.g., an automobile) exposed to ELF or VLF electric fields may cause current to pass through a person in contact with it.
- Magnetic field coupling to a conductor (for example, a wire fence) causes electric currents (of the same frequency as the exposing field) to pass through the body of a person in contact with it.
- Transient discharges (sparks) can occur when people and metal objects exposed to a strong electric field come into sufficiently close proximity.
- Electric or magnetic fields may interfere with implanted medical devices (e.g., unipolar cardiac pacemakers) and cause malfunction of the device.
The first two interactions listed above are examples of direct coupling between persons and ELF or VLF fields. The last four interactions are examples of indirect coupling mechanisms because they can occur only when the exposed organism is in the vicinity of other bodies. These bodies can include other humans or animals and objects such as automobiles, fences or implanted devices.
While other mechanisms of interaction between biological tissues and ELF or VLF fields have been postulated or there is some evidence to support their existence (WHO 1993; NRPB 1993; NRC 1996), none has been shown to be responsible for any adverse consequence to health.
Health effects
The evidence suggests that most of the established effects of exposure to electric and magnetic fields in the frequency range > 0 to 30 kHz result from acute responses to surface charge and induced current density. People can perceive the effects of the oscillating surface charge induced on their bodies by ELF electric fields (but not by magnetic fields); these effects become annoying if sufficiently intense. A summary of the effects of currents passing through the human body (thresholds for perception, let-go or tetanus) are given in table 3.
Table 3. Effects of currents passing through the human body
|
Effect |
Subject |
Threshold current in mA |
||||
|
50 and 60 Hz |
300 Hz |
1000 Hz |
10 kHz |
30 kHz |
||
|
Perception |
Men Women Children |
1.1 0.7 0.55 |
1.3 0.9 0.65 |
2.2 1.5 1.1 |
15 10 9 |
50 35 30 |
|
Let-go threshold shock |
Men Women Children |
9 6 4.5 |
11.7 7.8 5.9 |
16.2 10.8 8.1 |
55 37 27 |
126 84 63 |
|
Thoracic tetanization; |
Men Women Children |
23 15 12 |
30 20 15 |
41 27 20.5 |
94 63 47 |
320 214 160 |
Source: Bernhardt 1988a.
Human nerve and muscle cells have been stimulated by the currents induced by exposure to magnetic fields of several mT and 1 to 1.5 kHz; threshold current densities are thought to be above 1 A/m2. Flickering visual sensations can be induced in the human eye by exposure to magnetic fields as low as about 5 to 10 mT (at 20 Hz) or electric currents directly applied to the head. Consideration of these responses and of the results of neurophysiological studies suggests that subtle central nervous system functions, such as reasoning or memory, may be affected by current densities above 10 mA/m2 (NRPB 1993). Threshold values are likely to remain constant up to about 1 kHz but rise with increasing frequency thereafter.
Several in vitro studies (WHO 1993; NRPB 1993) have reported metabolic changes, such as alterations in enzyme activity and protein metabolism and decreased lymphocyte cytotoxicity, in various cell lines exposed to ELF and VLF electric fields and currents applied directly to the cell culture. Most effects have been reported at current densities between about 10 and 1,000 mA/m2, although these responses are less clearly defined (Sienkiewicz, Saunder and Kowalczuk 1991). However, it is worth noting that the endogenous current densities generated by the electrical activity of nerves and muscles are typically as high as 1 mA/m2 and may reach up to 10 mA/m2 in the heart. These current densities will not adversely affect nerve, muscle and other tissues. Such biological effects will be avoided by restricting the induced current density to less than 10 mA/m2 at frequencies up to about 1 kHz.
Several possible areas of biological interaction which have many health implications and about which our knowledge is limited include: possible changes in night-time melatonin levels in the pineal gland and alterations in circadian rhythms induced in animals by exposure to ELF electric or magnetic fields, and possible effects of ELF magnetic fields on the processes of development and carcinogenesis. In addition, there is some evidence of biological responses to very weak electric and magnetic fields: these include the altered mobility of calcium ions in brain tissue, changes in neuronal firing patterns, and altered operand behaviour. Both amplitude and frequency “windows” have been reported which challenge the conventional assumption that the magnitude of a response increases with increasing dose. These effects are not well established and do not provide a basis for establishing restrictions on human exposure, although further investigations are warranted (Sienkievicz, Saunder and Kowalczuk 1991; WHO 1993; NRC 1996).
Table 4 gives the approximate ranges of induced current densities for various biological effects in humans.
Table 4. Approximate current density ranges for various biological effects
|
Effect |
Current density (mA/m2) |
|
Direct nerve and muscle stimulation |
1,000–10,000 |
|
Modulation in central nervous system activity |
100–1,000 |
|
Changes in retinal function |
|
|
Endogenous current density |
1–10 |
Source: Sienkiewicz et al. 1991.
Occupational Exposure Standards
Nearly all standards having limits in the range > 0-30 kHz have, as their rationale, the need to keep induced electric fields and currents to safe levels. Usually the induced current densities are restricted to less than 10 mA/m2. Table 5 gives a summary of some current occupational exposure limits.
Table 5. Occupational limits of exposure to electric and magnetic fields in the frequency range > 0 to 30 kHz (note that f is in Hz)
|
Country/Reference |
Frequency range |
Electric field (V/m) |
Magnetic field (A/m) |
|
International (IRPA 1990) |
50/60 Hz |
10,000 |
398 |
|
USA (IEEE 1991) |
3–30 kHz |
614 |
163 |
|
USA (ACGIH 1993) |
1–100 Hz 100–4,000 Hz 4–30 kHz |
25,000 2.5 x 10⁶/f 625 |
60/f 60/f 60/f |
|
Germany (1996) |
50/60 Hz |
10,000 |
1,600 |
|
UK (NRPB 1993) |
1–24 Hz 24–600 Hz 600–1,000 Hz 1–30 kHz |
25,000 6 x 10⁵/f 1,000 1,000 |
64,000/f 64,000/f 64,000/f 64 |
Protective Measures
Occupational exposures that occur near high voltage transmission lines depend on the worker’s location either on the ground or at the conductor during live-line work at high potential. When working under live-line conditions, protective clothing may be used to reduce the electric field strength and current density in the body to values similar to those that would occur for work on the ground. Protective clothing does not weaken the influence of the magnetic field.
The responsibilities for the protection of workers and the general public against the potentially adverse effects of exposure to ELF or VLF electric and magnetic fields should be clearly assigned. It is recommended that the competent authorities consider the following steps:
- development and adoption of exposure limits and the implementation of a compliance programme
- development of technical standards to reduce the susceptibility to electromagnetic interference, for example, for pacemakers
- development of standards defining zones with limited access around sources of strong electric and magnetic fields because of electromagnetic interference (e.g., for pacemakers and other implanted devices). The use of appropriate warning signs should be considered.
- requirement of specific assignment of a person responsible for the safety of workers and the public at each site with high exposure potentials
- development of standardized measurement procedures and survey techniques
- requirements for the education of workers on the effects of exposure to ELF or VLF electric and magnetic fields and the measures and rules which are designed to protect them
- drafting of guidelines or codes of practice for worker safety in ELF or VLF electric and magnetic fields. ILO (1993a) provides excellent guidance for such a code.
Radiofrequency Fields and Microwaves
Radiofrequency (RF) electromagnetic energy and microwave radiation is used in a variety of applications in industry, commerce, medicine and research, as well as in the home. In the frequency range from 3 to 3 x 10⁸ kHz (that is, 300 GHz) we readily recognize applications such as radio and television broadcasting, communications (long-distance telephone, cellular telephone, radio communication), radar, dielectric heaters, induction heaters, switched power supplies and computer monitors.
High-power RF radiation is a source of thermal energy that carries all of the known implications of heating for biological systems, including burns, temporary and permanent changes in reproduction, cataracts and death. For the broad range of radiofrequencies, cutaneous perception of heat and thermal pain is unreliable for detection, because the thermal receptors are located in the skin and do not readily sense the deep heating of the body caused by these fields. Exposure limits are needed to protect against these adverse health effects of radiofrequency field exposure.
Occupational Exposure
Induction heating
By applying an intense alternating magnetic field a conducting material can be heated by induced eddy currents. Such heating is used for forging, annealing, brazing and soldering. Operating frequencies range from 50/60 to several million Hz. Since the dimensions of the coils producing the magnetic fields are often small, the risk of high-level whole-body exposure is small; however, exposure to the hands can be high.
Dielectric heating
Radiofrequency energy from 3 to 50 MHz (primarily at frequencies of 13.56, 27.12 and 40.68 MHz) is used in industry for a variety of heating processes. Applications include plastic sealing and embossing, glue drying, fabric and textile processing, woodworking and the manufacture of such diverse products as tarpaulins, swimming pools, waterbed liners, shoes, travel check folders and so on.
Measurements reported in the literature (Hansson Mild 1980; IEEE COMAR 1990a, 1990b, 1991) show that in many cases, electric and magnetic leakage fields are very high near these RF devices. Often the operators are women of child-bearing age (that is, 18 to 40 years). The leakage fields are often extensive in some occupational situations, resulting in whole-body exposure of operators. For many devices, the electric and magnetic field exposure levels exceed all existing RF safety guidelines.
Since these devices may give rise to very high absorption of RF energy, it is of interest to control the leakage fields which emanate from them. Thus, periodic RF monitoring becomes essential to determine whether an exposure problem exists.
Communication systems
Workers in the fields of communication and radar are exposed only to low-level field strengths in most situations. However, the exposure of workers who must climb FM/TV towers can be intense and safety precautions are necessary. Exposure can also be substantial near transmitter cabinets that have their interlocks defeated and doors open.
Medical exposure
One of the earliest applications of RF energy was short-wave diathermy. Unshielded electrodes are usually used for this, leading possibly to high stray fields.
Recently RF fields have been used in conjunction with static magnetic fields in magnetic resonance imaging (MRI). Since the RF energy used is low and the field is almost fully contained within the patient enclosure, the exposure to operators is negligible.
Biological Effects
The specific absorption rate (SAR, measured in watts per kilogram) is widely used as a dosimetric quantity, and exposure limits can be derived from SARs. The SAR of a biological body depends upon such exposure parameters as frequency of the radiation, intensity, polarization, configuration of the radiation source and the body, reflection surfaces and body size, shape and electrical properties. Furthermore, the SAR spatial distribution inside the body is highly non-uniform. Non-uniform energy deposition results in non-uniform deep-body heating and may produce internal temperature gradients. At frequencies above 10 GHz, the energy is deposited close to the body surface. The maximum SAR occurs at about 70 MHz for the standard subject, and at about 30 MHz when the person is standing in contact with RF ground. At extreme conditions of temperature and humidity, whole-body SARs of 1 to 4 W/kg at 70 MHz are expected to cause a core temperature rise of about 2 ºC in healthy human beings in one hour.
RF heating is an interaction mechanism that has been studied extensively. Thermal effects have been observed at less than 1 W/kg, but temperature thresholds have generally not been determined for these effects. The time-temperature profile must be considered in assessing biological effects.
Biological effects also occur where RF heating is neither an adequate nor a possible mechanism. These effects often involve modulated RF fields and millimetre wavelengths. Various hypotheses have been proposed but have not yet yielded information useful for deriving human exposure limits. There is a need to understand the fundamental mechanisms of interaction, since it is not practical to explore each RF field for its characteristic biophysical and biological interactions.
Human and animal studies indicate that RF fields can cause harmful biological effects because of excessive heating of internal tissues. The body’s heat sensors are located in the skin and do not readily sense heating deep within the body. Workers may therefore absorb significant amounts of RF energy without being immediately aware of the presence of leakage fields. There have been reports that personnel exposed to RF fields from radar equipment, RF heaters and sealers, and radio-TV towers have experienced a warming sensation some time after being exposed.
There is little evidence that RF radiation can initiate cancer in humans. Nevertheless, a study has suggested that it may act as a cancer promoter in animals (Szmigielski et al. 1988). Epidemiological studies of personnel exposed to RF fields are few in number and are generally limited in scope (Silverman 1990; NCRP 1986; WHO 1981). Several surveys of occupationally exposed workers have been conducted in the former Soviet Union and Eastern European countries (Roberts and Michaelson 1985). However, these studies are not conclusive with respect to health effects.
Human assessment and epidemiological studies on RF sealer operators in Europe (Kolmodin-Hedman et al. 1988; Bini et al. 1986) report that the following specific problems may arise:
- RF burns or burns from contact with thermally hot surfaces
- numbness (i.e., paresthesia) in hands and fingers; disturbed or altered tactile sensitivity
- eye irritation (possibly due to fumes from vinyl-containing material)
- significant warming and discomfort of the legs of operators (perhaps due to current flow through legs to ground).
Mobile Phones
The use of personal radiotelephones is rapidly increasing and this has led to an increase in the number of base stations. These are often sited in public areas. However, the exposure to the public from these stations is low. The systems usually operate on frequencies near 900 MHz or 1.8 GHz using either analogue or digital technology. The handsets are small, low power radio transmitters that are held in close proximity to the head when in use. Some of the power radiated from the antenna is absorbed by the head. Numerical calculations and measurements in phantom heads show that the SAR values can be of the order of a few W/kg (see further ICNIRP statement, 1996). Public concern about the health hazard of the electromagnetic fields has increased and several research programmes are being devoted to this question (McKinley et al., unpublished report). Several epidemiological studies are ongoing with respect to mobile phone use and brain cancer. So far only one animal study (Repacholi et al. 1997) with transgenic mice exposed 1 h per day for 18 months to a signal similar to that used in digital mobile communication has been published. By the end of the experiments 43 of 101 exposed animals had lymphomas, compared to 22 of 100 in the sham-exposed group. The increase was statistically significant (p > 0.001). These results cannot easily be interpreted with relevance to human health and further research on this is needed.
Standards and Guidelines
Several organizations and governments have issued standards and guidelines for protection from excessive exposure to RF fields. A review of worldwide safety standards was given by Grandolfo and Hansson Mild (1989); the discussion here pertains only to the guidelines issued by IRPA (1988) and IEEE standard C 95.1 1991.
The full rationale for RF exposure limits is presented in IRPA (1988). In summary, the IRPA guidelines have adopted a basic limiting SAR value of 4 W/kg, above which there is considered to be an increasing likelihood that adverse health consequences can occur as a result of RF energy absorption. No adverse health effects have been observed due to acute exposures below this level. Incorporating a safety factor of ten to allow for possible consequences of long-term exposure, 0.4 W/kg is used as the basic limit for deriving exposure limits for occupational exposure. A further safety factor of five is incorporated to derive limits for the general public.
Derived exposure limits for the electric field strength (E), the magnetic field strength (H) and the power density specified in V/m, A/m and W/m2 respectively, are shown in figure 1. The squares of the E and H fields are averaged over six minutes, and it is recommended that the instantaneous exposure not exceed the time-averaged values by more than a factor of 100. Furthermore, the body-to-ground current should not exceed 200 mA.
Figure 1. IRPA (1988) exposure limits for electric field strength E, magnetic field strength H and power density
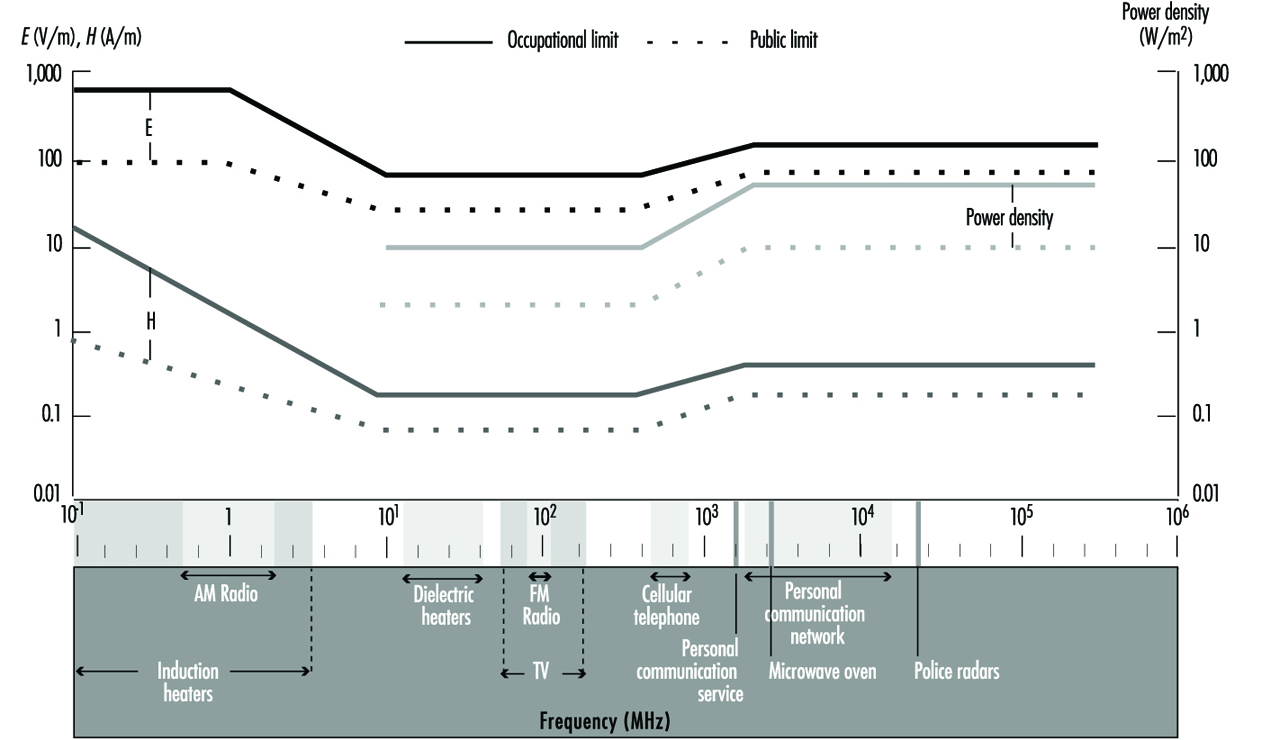
Standard C 95.1, set in 1991, by the IEEE gives limiting values for occupational exposure (controlled environment) of 0.4 W/kg for the average SAR over a person’s entire body, and 8 W/kg for the peak SAR delivered to any one gram of tissue for 6 minutes or more. The corresponding values for exposure to the general public (uncontrolled environment) are 0.08 W/kg for whole-body SAR and 1.6 W/kg for peak SAR. The body-to-ground current should not exceed 100 mA in a controlled environment and 45 mA in an uncontrolled environment. (See IEEE 1991 for further details.) The derived limits are shown in figure 2.
Figure 2. IEEE (1991) exposure limits for electric field strength E, magnetic field strength H and power density
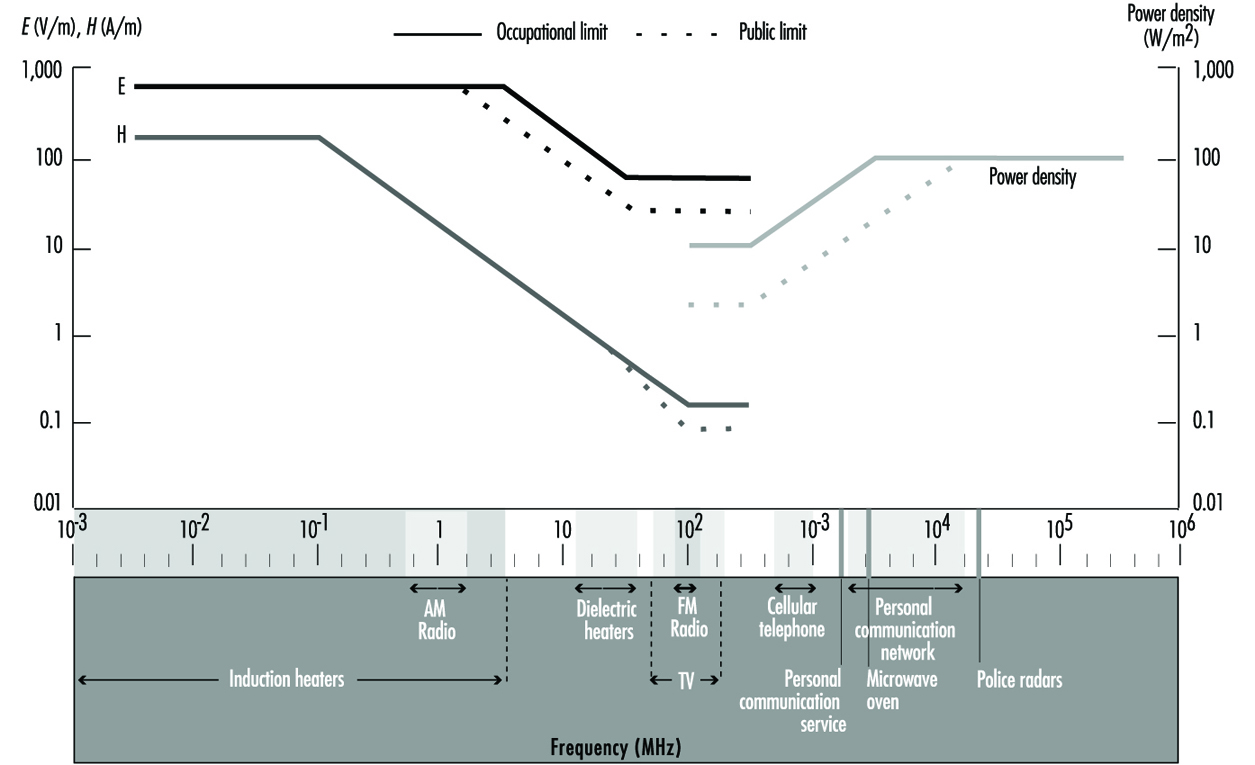
Further information on radiofrequency fields and microwaves can be found in, for instance, Elder et al. 1989, Greene 1992, and Polk and Postow 1986.
Lasers
A laser is a device which produces coherent electromagnetic radiant energy within the optical spectrum from the extreme ultraviolet to the far infrared (submillimetre). The term laser is actually an acronym for light amplification by stimulated emission of radiation. Although the laser process was theoretically predicted by Albert Einstein in 1916, the first successful laser was not demonstrated until 1960. In recent years lasers have found their way from the research laboratory to the industrial, medical and office setting as well as construction sites and even households. In many applications, such as videodisk players and optical fibre communication systems, the laser’s radiant energy output is enclosed, the user faces no health risk, and the presence of a laser embedded in the product may not be obvious to the user. However, in some medical, industrial or research applications, the laser’s emitted radiant energy is accessible and may pose a potential hazard to the eye and skin.
Because the laser process (sometimes referred to as “lasing”) can produce a highly collimated beam of optical radiation (i.e., ultraviolet, visible or infrared radiant energy), a laser can pose a hazard at a considerable distance—quite unlike most hazards encountered in the workplace. Perhaps it is this characteristic more than anything else that has led to special concerns expressed by workers and by occupational health and safety experts. Nevertheless, lasers can be used safely when appropriate hazard controls are applied. Standards for the safe use of lasers exist worldwide, and most are “harmonized” with each other (ANSI 1993; IEC 1993). All of the standards make use of a hazard classification system, which groups laser products into one of four broad hazard classes according to the laser’s output power or energy and its ability to cause harm. Safety measures are then applied commensurate to the hazard classification (Cleuet and Mayer 1980; Duchene, Lakey and Repacholi 1991).
Lasers operate at discrete wavelengths, and although most lasers are monochromatic (emitting one wavelength, or single colour), it is not uncommon for a laser to emit several discrete wavelengths. For example, the argon laser emits several different lines within the near ultraviolet and visible spectrum, but is generally designed to emit only one green line (wavelength) at 514.5 nm and/or a blue line at 488 nm. When considering potential health hazards, it is always crucial to establish the output wavelength(s).
All lasers have three fundamental building blocks:
- an active medium (a solid, liquid or gas) that defines the possible emission wavelengths
- an energy source (e.g., electric current, pump lamp or chemical reaction)
- a resonant cavity with output coupler (generally two mirrors).
Most practical laser systems outside of the research laboratory also have a beam delivery system, such as an optical fibre or articulated arm with mirrors to direct the beam to a work station, and focusing lenses to concentrate the beam on a material to be welded, etc. In a laser, identical atoms or molecules are brought to an excited state by energy delivered from the pump lamp. When the atoms or molecules are in an excited state, a photon (“particle” of light energy) can stimulate an excited atom or molecule to emit a second photon of the same energy (wavelength) travelling in phase (coherent) and in the same direction as the stimulating photon. Thus light amplification by a factor of two has taken place. This same process repeated in a cascade causes a light beam to develop that reflects back and forth between the mirrors of the resonant cavity. Since one of the mirrors is partially transparent, some light energy leaves the resonant cavity forming the emitted laser beam. Although in practice, the two parallel mirrors are often curved to produce a more stable resonant condition, the basic principle holds for all lasers.
Although several thousand different laser lines (i.e., discrete laser wavelengths characteristic of different active media) have been demonstrated in the physics laboratory, only 20 or so have been developed commercially to the point where they are routinely applied in everyday technology. Laser safety guidelines and standards have been developed and published which basically cover all wavelengths of the optical spectrum in order to allow for currently known laser lines and future lasers.
Laser Hazard Classification
Current laser safety standards throughout the world follow the practice of categorizing all laser products into hazard classes. Generally, the scheme follows a grouping of four broad hazard classes, 1 through 4. Class 1 lasers cannot emit potentially hazardous laser radiation and pose no health hazard. Classes 2 through 4 pose an increasing hazard to the eye and skin. The classification system is useful since safety measures are prescribed for each class of laser. More stringent safety measures are required for the highest classes.
Class 1 is considered an “eye-safe”, no-risk grouping. Most lasers that are totally enclosed (for example, laser compact disc recorders) are Class 1. No safety measures are required for a Class 1 laser.
Class 2 refers to visible lasers that emit a very low power that would not be hazardous even if the entire beam power entered the human eye and was focused on the retina. The eye’s natural aversion response to viewing very bright light sources protects the eye against retinal injury if the energy entering the eye is insufficient to damage the retina within the aversion response. The aversion response is composed of the blink reflex (approximately 0.16–0.18 second) and a rotation of the eye and movement of the head when exposed to such bright light. Current safety standards conservatively define the aversion response as lasting 0.25 second. Thus, Class 2 lasers have an output power of 1 milliwatt (mW) or less that corresponds to the permissible exposure limit for 0.25 second. Examples of Class 2 lasers are laser pointers and some alignment lasers.
Some safety standards also incorporate a subcategory of Class 2, referred to as “Class 2A”. Class 2A lasers are not hazardous to stare into for up to 1,000 s (16.7 min). Most laser scanners used in point-of-sales (super-market checkout) and inventory scanners are Class 2A.
Class 3 lasers pose a hazard to the eye, since the aversion response is insufficiently fast to limit retinal exposure to a momentarily safe level, and damage to other structures of the eye (e.g., cornea and lens) could also take place. Skin hazards normally do not exist for incidental exposure. Examples of Class 3 lasers are many research lasers and military laser rangefinders.
A special subcategory of Class 3 is termed “Class 3A” (with the remaining Class 3 lasers termed “Class 3B”). Class 3A lasers are those with an output power between one and five times the accessible emission limits (AEL) for the Class 1 or Class 2, but with an output irradiance not exceeding the relevant occupational exposure limit for the lower class. Examples are many laser alignment and surveying instruments.
Class 4 lasers may pose a potential fire hazard, a significant skin hazard or a diffuse-reflection hazard. Virtually all surgical lasers and material processing lasers used for welding and cutting are Class 4 if not enclosed. All lasers with an average power output exceeding 0.5 W are Class 4. If a higher power Class 3 or Class 4 is totally enclosed so that hazardous radiant energy is not accessible, the total laser system could be Class 1. The more hazardous laser inside the enclosure is termed an embedded laser.
Occupational Exposure Limits
The International Commission on Non-Ionizing Radiation Protection (ICNIRP 1995) has published guidelines for human exposure limits for laser radiation that are periodically updated. Representative exposure limits (ELs) are provided in table 1 for several typical lasers. Virtually all laser beams exceed permissible exposure limits. Thus, in actual practice, the exposure limits are not routinely used to determine safety measures. Instead, the laser classification scheme—which is based upon the ELs applied under realistic conditions—is really applied to this end.
Table 1. Exposure limits for typical lasers
|
Type of laser |
Principal wavelength(s) |
Exposure limit |
|
Argon fluoride |
193 nm |
3.0 mJ/cm2 over 8 h |
|
Xenon chloride |
308 nm |
40 mJ/cm2 over 8 h |
|
Argon ion |
488, 514.5 nm |
3.2 mW/cm2 for 0.1 s |
|
Copper vapour |
510, 578 nm |
2.5 mW/cm2 for 0.25 s |
|
Helium-neon |
632.8 nm |
1.8 mW/cm2 for 10 s |
|
Gold vapour |
628 nm |
1.0 mW/cm2 for 10 s |
|
Krypton ion |
568, 647 nm |
1.0 mW/cm2 for 10 s |
|
Neodymium-YAG |
1,064 nm |
5.0 μJ/cm2 for 1 ns to 50 μs |
|
Carbon dioxide |
10–6 μm |
100 mW/cm2 for 10 s |
|
Carbon monoxide |
≈5 μm |
to 8 h, limited area |
All standards/guidelines have MPE’s at other wavelengths and exposure durations.
Note: To convert MPE’s in mW/cm2 to mJ/cm2, multiply by exposure time t in seconds. For example, the He-Ne or Argon MPE at 0.1 s is 0.32 mJ/cm2.
Source: ANSI Standard Z-136.1(1993); ACGIH TLVs (1995) and Duchene, Lakey and Repacholi (1991).
Laser Safety Standards
Many nations have published laser safety standards, and most are harmonized with the international standard of the International Electrotechnical Commission (IEC). IEC Standard 825-1 (1993) applies to manufacturers; however, it also provides some limited safety guidance for users. The laser hazard classification described above must be labelled on all commercial laser products. A warning label appropriate to the class should appear on all products of Classes 2 through 4.
Safety Measures
The laser safety classification system greatly facilitates the determination of appropriate safety measures. Laser safety standards and codes of practice routinely require the use of increasingly more restrictive control measures for each higher classification.
In practice, it is always more desirable to totally enclose the laser and beam path so that no potentially hazardous laser radiation is accessible. In other words, if only Class 1 laser products are employed in the workplace, safe use is assured. However, in many situations, this is simply not practical, and worker training in safe use and hazard control measures is required.
Other than the obvious rule—not to point a laser at a person’s eyes—there are no control measures required for a Class 2 laser product. For lasers of higher classes, safety measures are clearly required.
If total enclosure of a Class 3 or 4 laser is not feasible, the use of beam enclosures (e.g., tubes), baffles and optical covers can virtually eliminate the risk of hazardous ocular exposure in most cases.
When enclosures are not feasible for Class 3 and 4 lasers, a laser controlled area with controlled entry should be established, and the use of laser eye protectors is generally mandated within the nominal hazard zone (NHZ) of the laser beam. Although in most research laboratories where collimated laser beams are used, the NHZ encompasses the entire controlled laboratory area, for focused beam applications, the NHZ may be surprisingly limited and not encompass the entire room.
To assure against misuse and possible dangerous actions on the part of unauthorized laser users, the key control found on all commercially manufactured laser products should be utilized.
The key should be secured when the laser is not in use, if people can gain access to the laser.
Special precautions are required during laser alignment and initial set-up, since the potential for serious eye injury is very great then. Laser workers must be trained in safe practices prior to laser set-up and alignment.
Laser-protective eyewear was developed after occupational exposure limits had been established, and specifications were drawn up to provide the optical densities (or ODs, a logarithmic measure of the attenuation factor) that would be needed as a function of wavelength and exposure duration for specific lasers. Although specific standards for laser eye protection exist in Europe, further guidelines are provided in the United States by the American National Standards Institute under the designations ANSI Z136.1 and ANSI Z136.3.
Training
When investigating laser accidents in both laboratory and industrial situations, a common element emerges: lack of adequate training. Laser safety training should be both appropriate and sufficient for the laser operations around which each employee will work. Training should be specific to the type of laser and the task to which the worker is assigned.
Medical Surveillance
Requirements for medical surveillance of laser workers vary from country to country in accordance with local occupational medicine regulations. At one time, when lasers were confined to the research laboratory and little was known about their biological effects, it was quite typical that each laser worker was periodically given a thorough general ophthalmological examination with fundus (retinal) photography to monitor the status of the eye. However, by the early 1970s, this practice was questioned, since the clinical findings were almost always negative, and it became clear that such exams could identify only acute injury which was subjectively detectable. This led the WHO task group on lasers, meeting in Don Leaghreigh, Ireland, in 1975, to recommend against such involved surveillance programmes and to emphasize testing of visual function. Since that time, most national occupational health groups have continuously reduced medical examination requirements. Today, complete ophthalmological examinations are universally required only in the event of a laser eye injury or suspected overexposure, and pre-placement visual screening is generally required. Additional examinations may be required in some countries.
Laser Measurements
Unlike some workplace hazards, there is generally no need to perform measurements for workplace monitoring of hazardous levels of laser radiation. Because of the highly confined beam dimensions of most laser beams, the likelihood of changing beam paths and the difficulty and expense of laser radiometers, current safety standards emphasize control measures based upon hazard class and not workplace measurement (monitoring). Measurements must be performed by the manufacturer to assure compliance with laser safety standards and proper hazard classification. Indeed, one of the original justifications for laser hazard classification related to the great difficulty of performing proper measurements for hazard evaluation.
Conclusions
Although the laser is relatively new to the workplace, it is rapidly becoming ubiquitous, as are programmes concerned with laser safety. The keys to the safe use of lasers are first to enclose the laser radiant energy if at all possible, but if not possible, to set up adequate control measures and to train all personnel working with lasers.
Light and Infrared Radiation
Light and infrared (IR) radiant energy are two forms of optical radiation, and together with ultraviolet radiation, they form the optical spectrum. Within the optical spectrum, different wavelengths have considerably different potentials for causing biological effects, and for this reason the optical spectrum may be further subdivided.
The term light should be reserved for wavelengths of radiant energy between 400 and 760 nm, which evoke a visual response at the retina (CIE 1987). Light is the essential component of the output of illuminating lamps, visual displays and a wide variety of illuminators. Aside from the importance of illumination for seeing, some light sources may, however, pose unwanted physiological reactions such as disability and discomfort glare, flicker and other forms of eye stress due to poor ergonomic design of workplace tasks. The emission of intense light is also a potentially hazardous side-effect of some industrial processes, such as arc welding.
Infrared radiation (IRR, wavelengths 760 nm to 1 mm) may also be referred to quite commonly as thermal radiation (or radiant heat), and is emitted from any warm object (hot engines, molten metals and other foundry sources, heat-treated surfaces, incandescent electric lamps, radiant heating systems, etc.). Infrared radiation is also emitted from a large variety of electrical equipment such as electric motors, generators, transformers and various electronic equipment.
Infrared radiation is a contributory factor in heat stress. High ambient air temperature and humidity and a low degree of air circulation can combine with radiant heat to produce heat stress with the potential for heat injuries. In cooler environments, unwelcome or poorly designed sources of radiant heat can also produce discomfort—an ergonomic consideration.
Biological Effects
Occupational hazards presented to the eye and skin by visible and infrared forms of radiation are limited by the eye’s aversion to bright light and the pain sensation in the skin resulting from intense radiant heating. The eye is well-adapted to protect itself against acute optical radiation injury (due to ultraviolet, visible or infrared radiant energy) from ambient sunlight. It is protected by a natural aversion response to viewing bright light sources that normally protects it against injury arising from exposure to sources such as the sun, arc lamps and welding arcs, since this aversion limits the duration of exposure to a fraction (about two-tenths) of a second. However, sources rich in IRR without a strong visual stimulus can be hazardous to the lens of the eye in the case of chronic exposure. One can also force oneself to stare at the sun, a welding arc or a snow field and thereby suffer a temporary (and sometimes a permanent) loss of vision. In an industrial setting in which bright lights appear low in the field of view, the eye’s protective mechanisms are less effective, and hazard precautions are particularly important.
There are at least five separate types of hazards to the eye and skin from intense light and IRR sources, and protective measures must be chosen with an understanding of each. In addition to the potential hazards presented by ultraviolet radiation (UVR) from some intense light sources, one should consider the following hazards (Sliney and Wolbarsht 1980; WHO 1982):
- Thermal injury to the retina, which can occur at wavelengths from 400 nm to 1,400 nm. Normally the danger of this type of injury is posed only by lasers, a very intense xenon-arc source or a nuclear fireball. The local burning of the retina results in a blind spot (scotoma).
- Blue-light photochemical injury to the retina (a hazard principally associated with blue light of wavelengths from 400 nm to 550 nm) (Ham 1989). The injury is commonly termed “blue light” photoretinitis; a particular form of this injury is named, according to its source, solar retinitis. Solar retinitis was once referred to as “eclipse blindness” and associated “retinal burn”. Only in recent years has it become clear that photoretinitis results from a photochemical injury mechanism following exposure of the retina to shorter wavelengths in the visible spectrum, namely, violet and blue light. Until the 1970s, it was thought to be the result of a thermal injury mechanism. In contrast to blue light, IRA radiation is very ineffective in producing retinal injuries. (Ham 1989; Sliney and Wolbarsht 1980).
- Near-infrared thermal hazards to the lens (associated with wavelengths of approximately 800 nm to 3,000 nm) with potential for industrial heat cataract. The average corneal exposure to infrared radiation in sunlight is of the order of 10 W/m2. By comparison, glass and steel workers exposed to infrared irradiances of the order of 0.8 to 4 kW/m2 daily for 10 to 15 years have reportedly developed lenticular opacities (Sliney and Wolbarsht 1980). These spectral bands include IRA and IRB (see figure 1). The American Conference of Governmental Industrial Hygienists (ACGIH) guideline for IRA exposure of the anterior of the eye is a time-weighted total irradiance of 100 W/m2 for exposure durations exceeding 1,000 s (16.7 min) (ACGIH 1992 and 1995).
- Thermal injury of the cornea and conjunctiva (at wavelengths of approximately 1,400 nm to 1 mm). This type of injury is almost exclusively limited to exposure to laser radiation.
- Thermal injury of the skin. This is rare from conventional sources but can occur across the entire optical spectrum.
The importance of wavelength and time of exposure
Thermal injuries (1) and (4) above are generally limited to very brief exposure durations, and eye protection is designed to prevent these acute injuries. However, photochemical injuries, such as are mentioned in (2) above, can result from low dose rates spread over the entire workday. The product of the dose rate and the exposure duration always results in the dose (it is the dose that governs the degree of photochemical hazard). As with any photochemical injury mechanism, one must consider the action spectrum which describes the relative effectiveness of different wavelengths in causing a photobiological effect. For example, the action spectrum for photochemical retinal injury peaks at approximately 440 nm (Ham 1989). Most photochemical effects are limited to a very narrow range of wavelengths; whereas a thermal effect can occur at any wavelength in the spectrum. Hence, eye protection for these specific effects need block only a relatively narrow spectral band in order to be effective. Normally, more than one spectral band must be filtered in eye protection for a broad-band source.
Sources of Optical Radiation
Sunlight
The greatest occupational exposure to optical radiation results from exposure of outdoor workers to the sun’s rays. The solar spectrum extends from the stratospheric ozone-layer cut-off of about of 290-295 nm in the ultraviolet band to at least 5,000 nm (5 μm) in the infrared band. Solar radiation can attain a level as high as 1 kW/m2 during the summer months. It can result in heat stress, depending upon ambient air temperature and humidity.
Artificial sources
The most significant artificial sources of human exposure to optical radiation include the following:
- Welding and cutting. Welders and their co-workers are typically exposed not only to intense UV radiation, but also to intense visible and IR radiation emitted from the arc. Under rare instances, these sources have produced acute injury to the retina of the eye. Eye protection is mandatory for these environments.
- Metals industries and foundries. The most significant source of visible and infrared exposure are from molten and hot metal surfaces in the steel and aluminium industries and in foundries. Worker exposure typically ranges from 0.5 to 1.2 kW/m2.
- Arc lamps. Many industrial and commercial processes, such as those involving photochemical curing lamps, emit intense, short-wave visible (blue) light as well as UV and IR radiation. While the likelihood of harmful exposure is low due to shielding, in some cases accidental exposure can occur.
- Infrared lamps. These lamps emit predominantly in the IRA range and are generally used for heat treatment, paint drying and related applications. These lamps do not pose any significant exposure hazard to humans since the discomfort produced upon exposure will limit exposure to a safe level.
- Medical treatment. Infrared lamps are used in physical medicine for a variety of diagnostic and therapeutic purposes. Exposures to the patient vary considerably according to the type of treatment, and IR lamps require careful use by staff members.
- General lighting. Fluorescent lamps emit very little infrared and are generally not bright enough to pose a potential hazard to the eye. Tungsten and tungsten-halogen incandescent lamps emit a large fraction of their radiant energy in the infrared. Additionally, the blue light emitted by tungsten-halogen lamps can pose a retinal hazard if a person stares at the filament. Fortunately, the eye’s aversion response to bright light prevents acute injury even at short distances. Placing glass “heat” filters over these lamps should minimize/eliminate this hazard.
- Optical projectors and other devices. Intense light sources are used in searchlights, film projectors and other light-beam collimating devices. These may pose a retinal hazard with the direct beam at very close distances.
Measurement of Source Properties
The most important characteristic of any optical source is its spectral power distribution. This is measured using a spectroradiometer, which consists of suitable input optics, a monochromator and a photodetector.
In many practical situations, a broad-band optical radiometer is used to select a given spectral region. For both visible illumination and safety purposes, the spectral response of the instrument will be tailored to follow a biological spectral response; for example, lux-meters are geared to the photopic (visual) response of the eye. Normally, aside from UVR hazard meters, the measurement and hazard analysis of intense light sources and infrared sources is too complex for routine occupational health and safety specialists. Progress is being made in standardizations of safety categories of lamps, so that measurements by the user will not be required in order to determine potential hazards.
Human Exposure Limits
From knowledge of the optical parameters of the human eye and the radiance of a light source, it is possible to calculate irradiances (dose rates) at the retina. Exposure of the anterior structures of the human eye to infrared radiation may also be of interest, and it should be further borne in mind that the relative position of the light source and the degree of lid closure can greatly affect the proper calculation of an ocular exposure dose. For ultraviolet and short-wavelength light exposures, the spectral distribution of the light source is also important.
A number of national and international groups have recommended occupational exposure limits (ELs) for optical radiation (ACGIH 1992 and 1994; Sliney 1992). Although most such groups have recommended ELs for UV and laser radiation, only one group has recommended ELs for visible radiation (i.e., light), namely, the ACGIH, an agency well-known in the field of occupational health. The ACGIH refers to its ELs as threshold limit values, or TLVs, and as these are issued yearly, there is an opportunity for a yearly revision (ACGIH 1992 and 1995). They are based in large part on ocular injury data from animal studies and from data from human retinal injuries resulting from viewing the sun and welding arcs. TLVs are furthermore based on the underlying assumption that outdoor environmental exposures to visible radiant energy are normally not hazardous to the eye except in very unusual environments, such as snow fields and deserts, or when one actually fixes the eyes on the sun.
Optical Radiation Safety Evaluation
Since a comprehensive hazard evaluation requires complex measurements of spectral irradiance and radiance of the source, and sometimes very specialized instruments and calculations as well, it is rarely carried out onsite by industrial hygienists and safety engineers. Instead, the eye protective equipment to be deployed is mandated by safety regulations in hazardous environments. Research studies evaluated a wide range of arcs, lasers and thermal sources in order to develop broad recommendations for practical, easier-to-apply safety standards.
Protective Measures
Occupational exposure to visible and IR radiation is seldom hazardous and is usually beneficial. However, some sources emit a considerable amount of visible radiation, and in this case, the natural aversion response is evoked, so there is little chance of accidental overexposure of the eyes. On the other hand, accidental exposure is quite likely in the case of artificial sources emitting only near-IR radiation. Measures which can be taken to minimize the unnecessary exposure of staff to IR radiation include proper engineering design of the optical system in use, wearing appropriate goggles or face visors, limiting access to persons directly concerned with the work, and ensuring that workers are aware of the potential hazards associated with exposure to intense visible and IR radiation sources. Maintainance staff who replace arc lamps must have adequate training so as to preclude hazardous exposure. It is unacceptable for workers to experience either skin erythema or photokeratitis. If these conditions do occur, working practices should be examined and steps taken to ensure that overexposure is made unlikely in the future. Pregnant operators are at no specific risk to optical radiation as regards the integrity of their pregnancy.
Eye protector design and standards
The design of eye protectors for welding and other operations presenting sources of industrial optical radiation (e.g., foundry work, steel and glass manufacture) started at the beginning of this century with the development of Crooke’s glass. Eye protector standards which evolved later followed the general principle that since infrared and ultraviolet radiation are not needed for vision, those spectral bands should be blocked as best as possible by currently available glass materials.
The empirical standards for eye protective equipment were tested in the 1970s and were shown to have included large safety factors for infrared and ultraviolet radiation when the transmission factors were tested against current occupational exposure limits, whereas the protection factors for blue light were just sufficient. Some standards’ requirements were therefore adjusted.
Ultraviolet and infrared radiation protection
A number of specialized UV lamps are used in industry for fluorescence detection and for photocuring of inks, plastic resins, dental polymers and so on. Although UVA sources normally pose little risk, these sources may either contain trace amounts of hazardous UVB or pose a disability glare problem (from fluorescence of the eye’s crystalline lens). UV filter lenses, glass or plastic, with very high attenuation factors are widely available to protect against the entire UV spectrum. A slight yellowish tint may be detectable if protection is afforded to 400 nm. It is of paramount importance for this type of eyewear (and for industrial sunglasses) to provide protection for the peripheral field of vision. Side shields or wraparound designs are important to protect against the focusing of temporal, oblique rays into the nasal equatorial area of the lens, where cortical cataract frequently originates.
Almost all glass and plastic lens materials block ultraviolet radiation below 300 nm and infrared radiation at wavelengths greater than 3,000 nm (3 μm), and for a few lasers and optical sources, ordinary impact-resistant clear safety eyewear will provide good protection (e.g., clear polycarbonate lenses effectively block wavelengths greater than 3 μm). However, absorbers such as metal oxides in glass or organic dyes in plastics must be added to eliminate UV up to about 380–400 nm, and infrared beyond 780 nm to 3 μm. Depending upon the material, this may be either easy or very difficult or expensive, and the stability of the absorber may vary somewhat. Filters that meet the American National Standards Institute’s ANSI Z87.1 standard must have the appropriate attenuation factors in each critical spectral band.
Protection in various industries
Fire-fighting
Fire-fighters may be exposed to intense near-infrared radiation, and aside from the crucially important head and face protection, IRR attenuating filters are frequently prescribed. Here, impact protection is also important.
Foundry and glass industry eyewear
Spectacles and goggles designed for ocular protection against infrared radiation generally have a light greenish tint, although the tint may be darker if some comfort against visible radiation is desired. Such eye protectors should not be confused with the blue lenses used with steel and foundry operations, where the objective is to check the temperature of the melt visually; these blue spectacles do not provide protection, and should be worn only briefly.
Welding
Infrared and ultraviolet filtration properties can be readily imparted to glass filters by means of additives such as iron oxide, but the degree of strictly visible attenuation determines the shade number, which is a logarithmic expression of attenuation. Normally a shade number of 3 to 4 is used for gas welding (which calls for goggles), and a shade number of 10 to 14 for arc welding and plasma arc operations (here, helmet protection is required). The rule of thumb is that if the welder finds the arc comfortable to view, adequate attenuation is provided against ocular hazards. Supervisors, welder’s helpers and other persons in the work area may require filters with a relatively low shade number (e.g., 3 to 4) to protect against photokeratitis (“arc eye” or “welder’s flash”). In recent years a new type of welding filter, the autodarkening filter has appeared on the scene. Regardless of the type of filter, it should meet ANSI Z87.1 and Z49.1 standards for fixed welding filters specified for dark shade (Buhr and Sutter 1989; CIE 1987).
Autodarkening welding filters
The autodarkening welding filter, whose shade number increases with the intensity of the optical radiation impinging upon it, represents an important advance in the ability of welders to produce consistently high-quality welds more efficiently and ergonomically. Formerly, the welder had to lower and raise the helmet or filter each time an arc was started and quenched. The welder had to work “blind” just prior to striking the arc. Furthermore, the helmet is commonly lowered and raised with a sharp snap of the neck and head, which can lead to neck strain or more serious injuries. Faced with this uncomfortable and cumbersome procedure, some welders frequently initiate the arc with a conventional helmet in the raised position—leading to photokeratitis. Under normal ambient lighting conditions, a welder wearing a helmet fitted with an autodarkening filter can see well enough with the eye protection in place to perform tasks such as aligning the parts to be welded, precisely positioning the welding equipment and striking the arc. In the most typical helmet designs, light sensors then detect the arc flash virtually as soon as it appears and direct an electronic drive unit to switch a liquid crystal filter from a light shade to a preselected dark shade, eliminating the need for the clumsy and hazardous manoeuvres practised with fixed-shade filters.
The question has frequently been raised whether hidden safety problems may develop with autodarkening filters. For example, can afterimages (“flash blindness”) experienced in the workplace result in permanently impaired vision? Do the new types of filter really offer a degree of protection that is equivalent or better than that which conventional fixed filters can provide? Although one can answer the second question in the affirmative, it must be understood that not all autodarkening filters are equivalent. Filter reaction speeds, the values of the light and dark shades achieved under a given intensity of illumination, and the weight of each unit may vary from one pattern of equipment to another. The temperature dependence of the unit’s performance, the variation in the degree of shade with electrical battery degradation, the “resting state shade” and other technical factors vary depending upon each manufacturer’s design. These considerations are being addressed in new standards.
Since adequate filter attenuation is afforded by all systems, the single most important attribute specified by the manufacturers of autodarkening filters is the speed of filter switching. Current autodarkening filters vary in switching speed from one tenth of a second to faster than 1/10,000th of a second. Buhr and Sutter (1989) have indicated a means of specifying the maximum switching time, but their formulation varies relative to the time-course of switching. Switching speed is crucial, since it gives the best clue to the all-important (but unspecified) measure of how much light will enter the eye when the arc is struck as compared with the light admitted by a fixed filter of the same working shade number. If too much light enters the eye for each switching during the day, the accumulated light-energy dose produces “transient adaptation” and complaints about “eye strain” and other problems. (Transient adaptation is the visual experience caused by sudden changes in one’s light environment, which may be characterized by discomfort, a sensation of having been exposed to glare and temporary loss of detailed vision.) Current products with switching speeds of the order of ten milliseconds will better provide adequate protection against photoretinitis. However, the shortest switching time—of the order of 0.1 ms—has the advantage of reducing transient adaptation effects (Eriksen 1985; Sliney 1992).
Simple check tests are available to the welder short of extensive laboratory testing. One might suggest to the welder that he or she simply look at a page of detailed print through a number of autodarkening filters. This will give an indication of each filter’s optical quality. Next, the welder may be asked to try striking an arc while observing it through each filter being considered for purchase. Fortunately, one can rely on the fact that light levels which are comfortable for viewing purposes will not be hazardous. The effectiveness of UV and IR filtration should be checked in the manufacturer’s specification sheet to make sure that unnecessary bands are filtered out. A few repeated arc strikings should give the welder a sense of whether discomfort will be experienced from transient adaptation, although a one-day trial would be best.
The resting or failure state shade number of an autodarkening filter (a failure state occurs when the battery fails) should provide 100% protection for the welder’s eyes for at least one to several seconds. Some manufacturers use a dark state as the “off” position and others use an intermediate shade between the dark and the light shade states. In either case, the resting state transmittance for the filter should be appreciably lower than the light shade transmittance in order to preclude a retinal hazard. In any case, the device should provide a clear and obvious indicator to the user as to when the filter is switched off or when a system failure occurs. This will ensure that the welder is warned in advance in case the filter is not switched on or is not operating properly before welding is begun. Other features, such as battery life or performance under extreme temperature conditions may be of importance to certain users.
Conclusions
Although technical specifications can appear to be somewhat complex for devices that protect the eye from optical radiation sources, safety standards exist which specify shade numbers, and these standards provide a conservative safety factor for the wearer.
Infrared Radiation
Infrared radiation is that part of the non-ionizing radiation spectrum located between microwaves and visible light. It is a natural part of the human environment and thus people are exposed to it in small amounts in all areas of daily life—for example, at home or during recreational activities in the sun. Very intense exposure, however, may result from certain technical processes at the workplace.
Many industrial processes involve thermal curing of various kinds of materials. The heat sources used or the heated material itself will usually emit such high levels of infrared radiation that a large number of workers are potentially at risk of being exposed.
Concepts and Quantities
Infrared radiation (IR) has wavelengths ranging from 780 nm to 1 mm. Following the classification by the International Commission on Illumination (CIE), this band is subdivided into IRA (from 780 nm to 1.4 μm), IRB (from 1.4 μm to 3 μm) and IRC (from 3 μm to 1 mm). This subdivision approximately follows the wavelength-dependent absorption characteristics of IR in tissue and the resulting different biological effects.
The amount and the temporal and spatial distribution of infrared radiation are described by different radiometric quantities and units. Due to optical and physiological properties, especially of the eye, a distinction is usually made between small “point” sources and “extended” sources. The criterion for this distinction is the value in radians of the angle (α) measured at the eye that is subtended by the source. This angle can be calculated as a quotient, the light source dimension DL divided by the viewing distance r. Extended sources are those which subtend a viewing angle at the eye greater than αmin, which normally is 11 milliradians. For all extended sources there is a viewing distance where α equals αmin; at greater viewing distances, the source can be treated like a point source. In optical radiation protection the most important quantities concerning extended sources are the radiance (L, expressed in Wm–2sr–1) and the time-integrated radiance (Lp in Jm–2sr–1), which describe the “brightness” of the source. For health risk assessment, the most relevant quantities concerning point sources or exposures at such distances from the source where α< αmin, are the irradiance (E, expressed in Wm–2), which is equivalent to the concept of exposure dose rate, and the radiant exposure (H, in Jm–2), equivalent to the exposure dose concept.
In some bands of the spectrum, the biological effects due to exposure are strongly dependent on wavelength. Therefore, additional spectroradiometric quantities must be used (e.g., the spectral radiance, Ll, expressed in Wm–2 sr–1 nm–1) to weigh the physical emission values of the source against the applicable action spectrum related to the biological effect.
Sources and Occupational Exposure
Exposure to IR results from various natural and artificial sources. The spectral emission from these sources may be limited to a single wavelength (laser) or may be distributed over a broad wavelength band.
The different mechanisms for the generation of optical radiation in general are:
- thermal excitation (black-body radiation)
- gas discharge
- light amplification by stimulated emission of radiation (laser), with the mechanism of gas discharge being of lesser importance in the IR band.
The emission from the most important sources used in many industrial processes results from thermal excitation, and can be approximated using the physical laws of black-body radiation if the absolute temperature of the source is known. The total emission (M, in Wm–2) of a black-body radiator (figure 1) is described by the Stefan-Boltzmann law:
M(T) = 5.67 x 10⁻⁸T4
and depends on the 4th power of the temperature (T, in K) of the radiating body. The spectral distribution of the radiance is described by Planck’s radiation law:

and the wavelength of maximum emission (λmax) is described according to Wien’s law by:
λmax = (2.898 x 10⁻⁸) / T
Figure 1. Spectral radiance λmaxof a black body radiator at the absolute temperature shown in degrees Kelvin on each curve
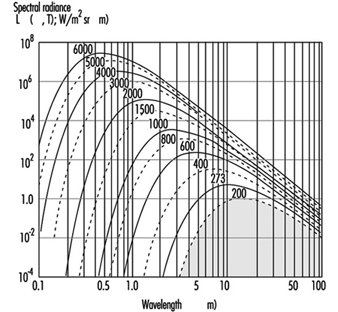
Many lasers used in industrial and medical processes will emit very high levels of IR. In general, compared with other radiation sources, laser radiation has some unusual features that may influence the risk following an exposure, such as very short pulse duration or extremely high irradiance. Therefore, laser radiation is discussed in detail elsewhere in this chapter.
Many industrial processes require the use of sources emitting high levels of visible and infrared radiation, and thus a large number of workers like bakers, glass blowers, kiln workers, foundry workers, blacksmiths, smelters and fire-fighters are potentially at risk of exposure. In addition to lamps, such sources as flames, gas torches, acetylene torches, pools of molten metal and incandescent metal bars must be considered. These are encountered in foundries, steel mills and in many other heavy industrial plants. Table 1 summarizes some examples of IR sources and their applications.
Table 1. Different sources of IR, population exposed and approximate exposure levels
|
Source |
Application or exposed population |
Exposure |
|
Sunlight |
Outdoor workers, farmers, construction workers, seafarers, general public |
500 Wm–2 |
|
Tungsten filament lamps |
General population and workers |
105–106 Wm–2sr–1 |
|
Tungsten halogen filament lamps |
(See tungsten filament lamps) |
50–200 Wm–2 (at 50 cm) |
|
Light emitting diodes (e.g. GaAs diode) |
Toys, consumer electronics, data transmission technology, etc. |
105 Wm–2sr–1 |
|
Xenon arc lamps |
Projectors, solar simulators, search lights |
107 Wm–2sr–1 |
|
Iron melt |
Steel furnace, steel mill workers |
105 Wm–2sr–1 |
|
Infrared lamp arrays |
Industrial heating and drying |
103 to 8.103 Wm–2 |
|
Infrared lamps in hospitals |
Incubators |
100–300 Wm–2 |
Biological Effects
Optical radiation in general does not penetrate very deeply into biological tissue. Therefore, the primary targets of an IR exposure are the skin and the eye. Under most exposure conditions the main interaction mechanism of IR is thermal. Only the very short pulses that lasers may produce, but which are not considered here, can also lead to mechanothermal effects. Effects from ionization or from the breakage of chemical bonds are not expected to appear with IR radiation because the particle energy, being less than approximately 1.6 eV, is too low to cause such effects. For the same reason, photochemical reactions become significant only at shorter wavelengths in the visual and in the ultraviolet region. The different wavelength-dependent health effects of IR arise mainly from the wavelength-dependent optical properties of tissue—for example, the spectral absorption of the ocular media (figure 2).
Figure 2. Spectral absorption of the ocular media
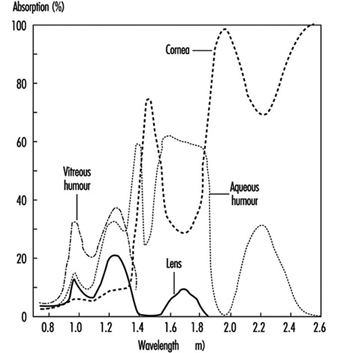
Effects on the eye
In general, the eye is well adapted to protect itself against optical radiation from the natural environment. In addition, the eye is physiologically protected against injury from bright light sources, such as the sun or high intensity lamps, by an aversion response that limits the duration of exposure to a fraction of a second (approximately 0.25 seconds).
IRA affects primarily the retina, because of the transparency of the ocular media. When directly viewing a point source or laser beam, the focusing properties in the IRA region additionally render the retina much more susceptible to damage than any other part of the body. For short exposure periods, heating of the iris from the absorption of visible or near IR is considered to play a role in the development of opacities in the lens.
With increasing wavelength, above approximately 1 μm, the absorption by ocular media increases. Therefore, absorption of IRA radiation by both the lens and the pigmented iris is considered to play a role in the formation of lenticular opacities. Damage to the lens is attributed to wavelengths below 3 μm (IRA and IRB). For infrared radiation of wavelengths longer than 1.4 μm, the aqueous humour and the lens are particularly strongly absorbent.
In the IRB and IRC region of the spectrum, the ocular media become opaque as a result of the strong absorption by their constituent water. Absorption in this region is primarily in the cornea and in the aqueous humour. Beyond 1.9 μm, the cornea is effectively the sole absorber. The absorption of long wavelength infrared radiation by the cornea may lead to increased temperatures in the eye due to thermal conduction. Because of a quick turnover rate of the surface corneal cells, any damage limited to the outer corneal layer can be expected to be temporary. In the IRC band the exposure can cause a burn on the cornea similar to that on the skin. Corneal burns are not very likely to occur, however, because of the aversion reaction triggered by the painful sensation caused by strong exposure.
Effects on the skin
Infrared radiation will not penetrate the skin very deeply. Therefore, exposure of the skin to very strong IR may lead to local thermal effects of different severity, and even serious burns. The effects on the skin depend on the optical properties of the skin, such as wavelength-dependent depth of penetration (figure 3 ). Especially at longer wavelengths, an extensive exposure may cause a high local temperature rise and burns. The threshold values for these effects are time dependent, because of the physical properties of the thermal transport processes in the skin. An irradiation of 10 kWm–2, for example, may cause a painful sensation within 5 seconds, whereas an exposure of 2 kWm–2 will not cause the same reaction within periods shorter than approximately 50 seconds.
Figure 3. Depth of penetration into the skin for different wavelengths
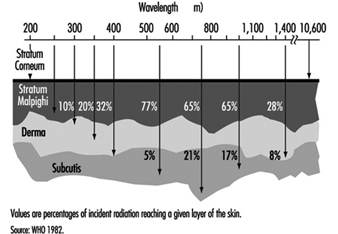
If the exposure is extended over very long periods, even at values well below the pain threshold, the burden of heat to the human body may be great. Especially if the exposure covers the whole body as, for example, in front of a steel melt. The result may be an imbalance of the otherwise physiologically well balanced thermoregulation system. The threshold for tolerating such an exposure will depend on different individual and environmental conditions, such as the individual capacity of the thermoregulation system, the actual body metabolism during exposure or the environmental temperature, humidity and air movement (wind speed). Without any physical work, a maximum exposure of 300 Wm–2 may be tolerated over eight hours under certain environmental conditions, but this value decreases to approximately 140 Wm–2 during heavy physical work.
Exposure Standards
The biological effects of IR exposure which are dependent on wavelength and on the duration of exposure, are intolerable only if certain threshold intensity or dose values are exceeded. To protect against such intolerable exposure conditions, international organizations such as the World Health Organization (WHO), the International Labour Office (ILO), the International Committee for Non-Ionizing Radiation of the International Radiation Protection Association (INIRC/IRPA), and its successor, the International Commission on Non-Ionizing Radiation Protection (ICNIRP) and the American Conference of Governmental Industrial Hygienists (ACGIH) have suggested exposure limits for infrared radiation from both coherent and incoherent optical sources. Most of the national and international suggestions on guidelines for limiting human exposure to infrared radiation are either based on or even identical with the suggested threshold limit values (TLVs) published by the ACGIH (1993/1994). These limits are widely recognized and are frequently used in occupational situations. They are based on current scientific knowledge and are intended to prevent thermal injury of the retina and cornea and to avoid possible delayed effects on the lens of the eye.
The 1994 revision of the ACGIH exposure limits is as follows:
1. For the protection of the retina from thermal injury in case of exposure to visible light, (for example, in the case of powerful light sources), the spectral radiance Lλ in W/(m² sr nm) weighted against the retinal thermal hazard function Rλ (see table 2) over the wavelength interval Δλ and summed over the range of wavelength 400 to 1400 nm, should not exceed:
![]()
where t is the viewing duration limited to intervals from 10-3 to 10 seconds (that is, for accidental viewing conditions, not fixated viewing), and α is the angular subtense of the source in radians calculated by α = maximum extension of the source/distance to the source Rλ (table 2 ).
2. To protect the retina from the exposure hazards of infrared heat lamps or any near IR source where a strong visual stimulus is absent, the infrared radiance over the wavelength range 770 to 1400 nm as viewed by the eye (based on a 7 mm pupil diameter) for extended duration of viewing conditions should be limited to:
![]()
This limit is based on a pupil diameter of 7 mm since, in this case, the aversion response (closing the eye, for example) may not exist due to the absence of visible light.
3. To avoid possible delayed effects on the lens of the eye, such as delayed cataract, and to protect the cornea from overexposure, the infrared radiation at wavelengths greater than 770 nm should be limited to 100 W/m² for periods greater than 1,000 s and to:
![]()
or for shorter periods.
4. For aphakic patients, separate weighting functions and resulting TLVs are given for the wavelength range of ultraviolet and visible light (305–700 nm).
Table 2. Retinal thermal hazard function
|
Wavelength (nm) |
Rλ |
Wavelength (nm) |
Rλ |
|
400 |
1.0 |
460 |
8.0 |
|
405 |
2.0 |
465 |
7.0 |
|
410 |
4.0 |
470 |
6.2 |
|
415 |
8.0 |
475 |
5.5 |
|
420 |
9.0 |
480 |
4.5 |
|
425 |
9.5 |
485 |
4.0 |
|
430 |
9.8 |
490 |
2.2 |
|
435 |
10.0 |
495 |
1.6 |
|
440 |
10.0 |
500–700 |
1.0 |
|
445 |
9.7 |
700–1,050 |
10((700 - λ )/500) |
|
450 |
9.4 |
1,050–1,400 |
0.2 |
|
455 |
9.0 |
Source: ACGIH 1996.
Measurement
Reliable radiometric techniques and instruments are available that make it possible to analyse the risk to the skin and the eye from exposure to sources of optical radiation. For characterizing a conventional light source, it is generally very useful to measure the radiance. For defining hazardous exposure conditions from optical sources, the irradiance and the radiant exposure are of greater importance. The evaluation of broad-band sources is more complex than the evaluation of sources that emit at single wavelengths or very narrow bands, since spectral characteristics and source size must be considered. The spectrum of certain lamps consists of both a continuum emission over a wide wavelength band and emission on certain single wavelengths (lines). Significant errors may be introduced into the representation of those spectra if the fraction of energy in each line is not properly added to the continuum.
For health-hazard assessment the exposure values must be measured over a limiting aperture for which the exposure standards are specified. Typically a 1 mm aperture has been considered to be the smallest practical aperture size. Wavelengths greater than 0.1 mm present difficulties because of significant diffraction effects created by a 1 mm aperture. For this wavelength band an aperture of 1 cm² (11 mm diameter) was accepted, because hot spots in this band are larger than at shorter wavelengths. For the evaluation of retinal hazards, the size of the aperture was determined by an average pupil size and therefore an aperture of 7 mm was chosen.
In general, measurements in the optical region are very complex. Measurements taken by untrained personnel may lead to invalid conclusions. A detailed summary of measurement procedures is to be found in Sliney and Wolbarsht (1980).
Protective Measures
The most effective standard protection from exposure to optical radiation is the total enclosure of the source and all of the radiation pathways that may exit from the source. By such measures, compliance with the exposure limits should be easy to achieve in the majority of cases. Where this is not the case, personal protection is applicable. For example, available eye protection in the form of suitable goggles or visors or protective clothing should be used. If the work conditions will not allow for such measures to be applied, administrative control and restricted access to very intense sources may be necessary. In some cases a reduction of either the power of the source or the working time (work pauses to recover from heat stress), or both, might be a possible measure to protect the worker.
Conclusion
In general, infrared radiation from the most common sources such as lamps, or from most industrial applications, will not cause any risk to workers. At some workplaces, however, IR can cause a health risk for the worker. In addition, there is a rapid increase in the application and use of special-purpose lamps and in high temperature processes in industry, science and medicine. If the exposure from those applications is sufficiently high, detrimental effects (mainly in the eye but also on the skin) cannot be excluded. The importance of internationally recognized optical radiation exposure standards is expected to increase. To protect the worker from excessive exposure, protective measures like shielding (eye shields) or protective clothing should be mandatory.
The principal adverse biological effects attributed to infrared radiation are cataracts, known as glass blower’s or furnaceman’s cataracts. Long-term exposure even at relatively low levels causes heat stress to the human body. At such exposure conditions additional factors such as body temperature and evaporative heat loss as well as environmental factors must be considered.
In order to inform and instruct workers some practical guides were developed in industrial countries. A comprehensive summary can be found in Sliney and Wolbarsht (1980).
Ultraviolet Radiation
Like light, which is visible, ultraviolet radiation (UVR) is a form of optical radiation with shorter wavelengths and more energetic photons (particles of radiation) than its visible counterpart. Most light sources emit some UVR as well. UVR is present in sunlight and is also emitted from a large number of ultraviolet sources used in industry, science and medicine. Workers may encounter UVR in a wide variety of occupational settings. In some instances, at low ambient light levels, very intense near-ultraviolet (“black light”) sources can be seen, but normally UVR is invisible and must be detected by the glow of materials that fluoresce when illuminated by UVR.
Just as light can be divided into colours which can be seen in a rainbow, UVR is subdivided and its components are commonly denoted as UVA, UVB and UVC. Wavelengths of light and UVR are generally expressed in nanometres (nm); 1 nm is one-billionth (10–9) of a metre. UVC (very short-wavelength UVR) in sunlight is absorbed by the atmosphere and does not reach the Earth’s surface. UVC is available only from artificial sources, such as germicidal lamps, which emit most of their energy at a single wavelength (254 nm) that is very effective in killing bacteria and viruses on a surface or in the air.
UVB is the most biologically damaging UVR to the skin and eye, and although most of this energy (which is a component of sunlight) is absorbed by the atmosphere, it still produces sunburn and other biological effects. Long-wavelength UVR, UVA, is normally found in most lamp sources, and is also the most intense UVR reaching the Earth. Although UVA can penetrate deeply into tissue, it is not as biologically damaging as UVB because the energies of individual photons are less than for UVB or UVC.
Sources of Ultraviolet Radiation
Sunlight
The greatest occupational exposure to UVR is experienced by outdoor workers under sunlight. The energy of solar radiation is greatly attenuated by the earth’s ozone layer, limiting terrestrial UVR to wavelengths greater than 290-295 nm. The energy of the more dangerous short-wavelength (UVB) rays in sunlight is a strong function of the atmospheric slant path, and varies with the season and the time of day (Sliney 1986 and 1987; WHO 1994).
Artificial sources
The most significant artificial sources of human exposure include the following:
Industrial arc welding. The most significant source of potential UVR exposure is the radiant energy of arc-welding equipment. The levels of UVR around arc-welding equipment are very high, and acute injury to the eye and the skin can occur within three to ten minutes of exposure at close viewing distances of a few metres. Eye and skin protection is mandatory.
Industrial/workplace UVR lamps. Many industrial and commercial processes, such as photochemical curing of inks, paints and plastics, involve the use of lamps which strongly emit in the UV range. While the likelihood of harmful exposure is low due to shielding, in some cases accidental exposure can occur.
“Black lights”. Black lights are specialized lamps that emit predominantly in the UV range, and are generally used for non-destructive testing with fluorescent powders, for the authentication of banknotes and documents, and for special effects in advertising and discotheques. These lamps do not pose any significant exposure hazard to humans (except in certain cases to photosensitized skin).
Medical treatment. UVR lamps are used in medicine for a variety of diagnostic and therapeutic purposes. UVA sources are normally used in diagnostic applications. Exposures to the patient vary considerably according to the type of treatment, and UV lamps used in dermatology require careful use by staff members.
Germicidal UVR lamps. UVR with wavelengths in the range 250–265 nm is the most effective for sterilization and disinfection since it corresponds to a maximum in the DNA absorption spectrum. Low-pressure mercury discharge tubes are often used as the UV source, as more than 90% of the radiated energy lies at the 254 nm line. These lamps are often referred to as “germicidal lamps,” “bactericidal lamps” or simply “UVC lamps”. Germicidal lamps are used in hospitals to combat tuberculosis infection, and are also used inside microbiological safety cabinets to inactivate airborne and surface microorganisms. Proper installation of the lamps and the use of eye protection is essential.
Cosmetic tanning. Sunbeds are found in enterprises where clients may obtain a tan by special sun-tanning lamps, which emit primarily in the UVA range but also some UVB. Regular use of a sunbed may contribute significantly to a person’s annual UV skin exposure; furthermore, the staff working in tanning salons may also be exposed to low levels. The use of eye protection such as goggles or sunglasses should be mandatory for the client, and depending upon the arrangement, even staff members may require eye protectors.
General lighting. Fluorescent lamps are common in the workplace and have been used in the home for a long time now. These lamps emit small amounts of UVR and contribute only a few percent to a person’s annual UV exposure. Tungsten-halogen lamps are increasingly used in the home and in the workplace for a variety of lighting and display purposes. Unshielded halogen lamps can emit UVR levels sufficient to cause acute injury at short distances. The fitting of glass filters over these lamps should eliminate this hazard.
Biological Effects
The skin
Erythema
Erythema, or “sunburn”, is a reddening of the skin that normally appears in four to eight hours after exposure to UVR and gradually fades after a few days. Severe sunburn can involve blistering and peeling of the skin. UVB and UVC are both about 1,000 times more effective in causing erythema than UVA (Parrish, Jaenicke and Anderson 1982), but erythema produced by the longer UVB wavelengths (295 to 315 nm) is more severe and persists longer (Hausser 1928). The increased severity and time-course of the erythema results from deeper penetration of these wavelengths into the epidermis. Maximum sensitivity of the skin apparently occurs at approximately 295 nm (Luckiesh, Holladay and Taylor 1930; Coblentz, Stair and Hogue 1931) with much less (approximately 0.07) sensitivity occurring at 315 nm and longer wavelengths (McKinlay and Diffey 1987).
The minimal erythemal dose (MED) for 295 nm that has been reported in more recent studies for untanned, lightly pigmented skin ranges from 6 to 30 mJ/cm2 (Everett, Olsen and Sayer 1965; Freeman, et al. 1966; Berger, Urbach and Davies 1968). The MED at 254 nm varies greatly depending upon the elapsed time after exposure and whether the skin has been exposed much to outdoor sunlight, but is generally of the order of 20 mJ/cm2, or as high as 0.1 J/cm2. Skin pigmentation and tanning, and, most importantly, thickening of the stratum corneum, can increase this MED by at least one order of magnitude.
Photosensitization
Occupational health specialists frequently encounter adverse effects from occupational exposure to UVR in photosensitized workers. The use of certain medicines may produce a photosensitizing effect on exposure to UVA, as may the topical application of certain products, including some perfumes, body lotions and so on. Reactions to photosensitizing agents involve both photoallergy (allergic reaction of the skin) and phototoxicity (irritation of the skin) after UVR exposure from sunlight or industrial UVR sources. (Photosensitivity reactions during the use of tanning equipment are also common.) This photosensitization of the skin may be caused by creams or ointments applied to the skin, by medications taken orally or by injection, or by the use of prescription inhalers (see figure 1 ). The physician prescribing a potentially photosensitizing medication should always warn the patient to take appropriate measures to ensure against adverse effects, but the patient frequently is told only to avoid sunlight and not UVR sources (since these are uncommon for the general population).
Figure 1. Some phonosensitizing substances
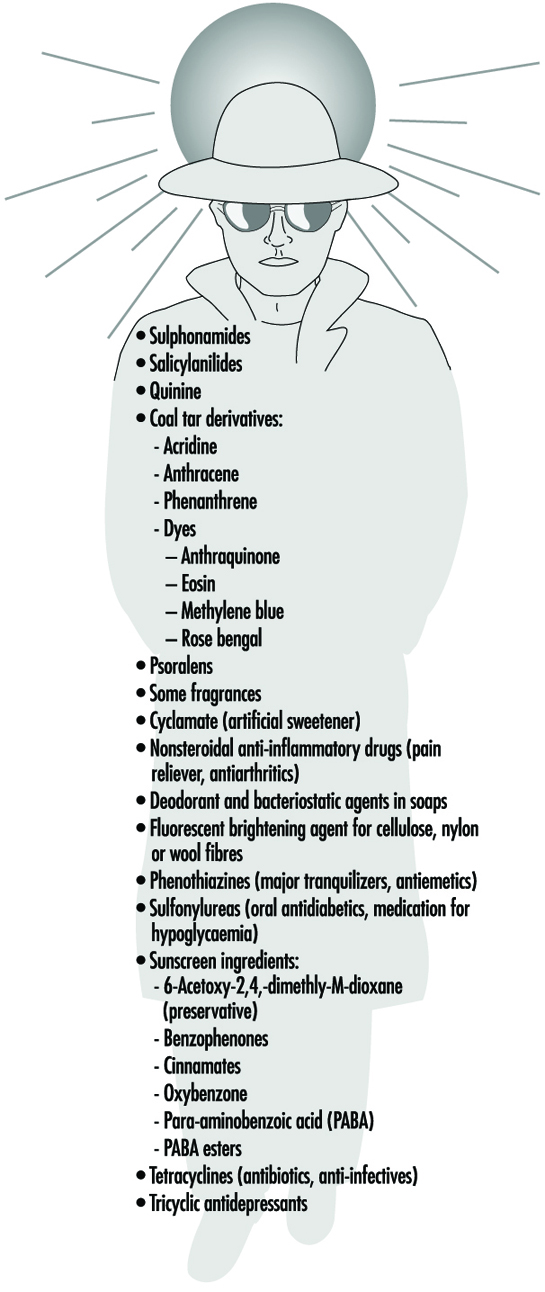
Delayed effects
Chronic exposure to sunlight—especially the UVB component—accelerates the ageing of the skin and increases the risk of developing skin cancer (Fitzpatrick et al. 1974; Forbes and Davies 1982; Urbach 1969; Passchier and Bosnjakovic 1987). Several epidemiological studies have shown that the incidence of skin cancer is strongly correlated with latitude, altitude and sky cover, which correlate with UVR exposure (Scotto, Fears and Gori 1980; WHO 1993).
Exact quantitative dose-response relationships for human skin carcinogenesis have not yet been established, although fair-skinned individuals, particularly those of Celtic origin, are much more prone to develop skin cancer. Nevertheless, it must be noted that the UVR exposures necessary to elicit skin tumours in animal models may be delivered sufficiently slowly that erythema is not produced, and the relative effectiveness (relative to the peak at 302 nm) reported in those studies varies in the same way as sunburn (Cole, Forbes and Davies 1986; Sterenborg and van der Leun 1987).
The eye
Photokeratitis and photoconjunctivitis
These are acute inflammatory reactions resulting from exposure to UVB and UVC radiation which appear within a few hours of excessive exposure and normally resolved after one to two days.
Retinal injury from bright light
Although thermal injury to the retina from light sources is unlikely, photochemical damage can occur from exposure to sources rich in blue light. This can result in temporary or permanent reduction in vision. However the normal aversion response to bright light should prevent this occurrence unless a conscious effort is made to stare at bright light sources. The contribution of UVR to retinal injury is generally very small because absorption by the lens limits retinal exposure.
Chronic effects
Long-term occupational exposure to UVR over several decades may contribute to cataract and such non-eye-related degenerative effects as skin ageing and skin cancer associated with sun exposure. Chronic exposure to infrared radiation also can increase the risk of cataract, but this is very unlikely, given access to eye protection.
Actinic ultraviolet radiation (UVB and UVC) is strongly absorbed by the cornea and conjunctiva. Overexposure of these tissues causes keratoconjunctivitis, commonly referred to as “welder’s flash”, “arc-eye” or “snow-blindness”. Pitts has reported the action spectrum and time course of photokeratitis in the human, rabbit and monkey cornea (Pitts 1974). The latent period varies inversely with the severity of exposure, ranging from 1.5 to 24 hours, but usually occurs within 6 to 12 hours; discomfort usually disappears within 48 hours. Conjunctivitis follows and may be accompanied by erythema of the facial skin surrounding the eyelids. Of course, UVR exposure rarely results in permanent ocular injury. Pitts and Tredici (1971) reported threshold data for photokeratitis in humans for wavebands 10 nm in width from 220 to 310 nm. The maximum sensitivity of the cornea was found to occur at 270 nm—differing markedly from the maximum for the skin. Presumably, 270 nm radiation is biologically more active because of the lack of a stratum corneum to attenuate the dose to the corneal epithelium tissue at shorter UVR wavelengths. The wavelength response, or action spectrum, did not vary as greatly as did the erythema action spectra, with thresholds varying from 4 to 14 mJ/cm2 at 270 nm. The threshold reported at 308 nm was approximately 100 mJ/cm2.
Repeated exposure of the eye to potentially hazardous levels of UVR does not increase the protective capability of the affected tissue (the cornea) as does skin exposure, which leads to tanning and to thickening of the stratum corneum. Ringvold and associates studied the UVR absorption properties of the cornea (Ringvold 1980a) and aqueous humour (Ringvold 1980b), as well as the effects of UVB radiation upon the corneal epithelium (Ringvold 1983), the corneal stroma (Ringvold and Davanger 1985) and the corneal endothelium (Ringvold, Davanger and Olsen 1982; Olsen and Ringvold 1982). Their electron microscopic studies showed that corneal tissue possessed remarkable repair and recovery properties. Although one could readily detect significant damage to all of these layers apparently appearing initially in cell membranes, morphological recovery was complete after a week. Destruction of keratocytes in the stromal layer was apparent, and endothelial recovery was pronounced despite the normal lack of rapid cell turnover in the endothelium. Cullen et al. (1984) studied endothelial damage that was persistent if the UVR exposure was persistent. Riley et al. (1987) also studied the corneal endothelium following UVB exposure and concluded that severe, single insults were not likely to have delayed effects; however, they also concluded that chronic exposure could accelerate changes in the endothelium related to ageing of the cornea.
Wavelengths above 295 nm can be transmitted through the cornea and are almost totally absorbed by the lens. Pitts, Cullen and Hacker (1977b) showed that cataracts can be produced in rabbits by wavelengths in the 295–320 nm band. Thresholds for transient opacities ranged from 0.15 to 12.6 J/cm2, depending on wavelength, with a minimum threshold at 300 nm. Permanent opacities required greater radiant exposures. No lenticular effects were noted in the wavelength range of 325 to 395 nm even with much higher radiant exposures of 28 to 162 J/cm2 (Pitts, Cullen and Hacker 1977a; Zuclich and Connolly 1976). These studies clearly illustrate the particular hazard of the 300-315 nm spectral band, as would be expected because photons of these wavelengths penetrate efficiently and have sufficient energy to produce photochemical damage.
Taylor et al. (1988) provided epidemiological evidence that UVB in sunlight was an aetiological factor in senile cataract, but showed no correlation of cataract with UVA exposure. Although once a popular belief because of the strong absorption of UVA by the lens, the hypothesis that UVA can cause cataract has not been supported by either experimental laboratory studies or by epidemiological studies. From the laboratory experimental data which showed that thresholds for photokeratitis were lower than for cataractogenesis, one must conclude that levels lower than those required to produce photokeratitis on a daily basis should be considered hazardous to lens tissue. Even if one were to assume that the cornea is exposed to a level nearly equivalent to the threshold for photokeratitis, one would estimate that the daily UVR dose to the lens at 308 nm would be less than 120 mJ/cm2 for 12 hours out of doors (Sliney 1987). Indeed, a more realistic average daily exposure would be less than half that value.
Ham et al. (1982) determined the action spectrum for photoretinitis produced by UVR in the 320–400 nm band. They showed that thresholds in the visible spectral band, which were 20 to 30 J/cm2 at 440 nm, were reduced to approximately 5 J/cm2 for a 10 nm band centred at 325 nm. The action spectrum was increasing monotonically with decreasing wavelength. We should therefore conclude that levels well below 5 J/cm2 at 308 nm should produce retinal lesions, although these lesions would not become apparent for 24 to 48 hours after the exposure. There are no published data for retinal injury thresholds below 325 nm, and one can only expect that the pattern for the action spectrum for photochemical injury to the cornea and lens tissues would apply to the retina as well, leading to an injury threshold of the order of 0.1 J/cm2.
Although UVB radiation has been clearly shown to be mutagenic and carcinogenic to the skin, the extreme rarity of carcinogenesis in the cornea and conjunctiva is quite remarkable. There appears to be no scientific evidence to link UVR exposure with any cancers of the cornea or conjunctiva in humans, although the same is not true of cattle. This would suggest a very effective immune system operating in the human eye, since there are certainly outdoor workers who receive a UVR exposure comparable to that which cattle receive. This conclusion is further supported by the fact that individuals suffering from a defective immune response, as in xeroderma pigmentosum, frequently develop neoplasias of the cornea and conjunctiva (Stenson 1982).
Safety Standards
Occupational exposure limits (EL) for UVR have been developed and include an action spectrum curve which envelops the threshold data for acute effects obtained from studies of minimal erythema and keratoconjunctivitis (Sliney 1972; IRPA 1989). This curve does not differ significantly from the collective threshold data, considering measurement errors and variations in individual response, and is well below the UVB cataractogenic thresholds.
The EL for UVR is lowest at 270 nm (0.003 J/cm2 at 270 nm), and, for example, at 308 nm is 0.12 J/cm2 (ACGIH 1995, IRPA 1988). Regardless of whether the exposure occurs from a few pulsed exposures during the day, a single very brief exposure, or from an 8-hour exposure at a few microwatts per square centimetre, the biological hazard is the same, and the above limits apply to the full workday.
Occupational Protection
Occupational exposure to UVR should be minimized where practical. For artificial sources, wherever possible, priority should be given to engineering measures such as filtration, shielding and enclosure. Administrative controls, such as limitation of access, can reduce the requirements for personal protection.
Outdoor workers such as agricultural workers, labourers, construction workers, fishermen and so on can minimize their risk from solar UV exposure by wearing appropriate tightly woven clothing, and most important, a brimmed hat to reduce face and neck exposure. Sunscreens can be applied to exposed skin to reduce further exposure. Outdoor workers should have access to shade and be provided with all the necessary protective measures mentioned above.
In industry, there are many sources capable of causing acute eye injury within a short exposure time. A variety of eye protection is available with various degrees of protection appropriate to the intended use. Those intended for industrial use include welding helmets (additionally providing protection both from intense visible and infrared radiation as well as face protection), face shields, goggles and UV-absorbing spectacles. In general, protective eyewear provided for industrial use should fit snugly on the face, thus ensuring that there are no gaps through which UVR can directly reach the eye, and they should be well-constructed to prevent physical injury.
The appropriateness and selection of protective eyewear is dependent on the following points:
- the intensity and spectral emission characteristics of the UVR source
- the behavioural patterns of people near UVR sources (distance and exposure time are important)
- the transmission properties of the protective eyewear material
- the design of the frame of the eyewear to prevent peripheral exposure of the eye from direct unabsorbed UVR.
In industrial exposure situations, the degree of ocular hazard can be assessed by measurement and comparison with recommended limits for exposure (Duchene, Lakey and Repacholi 1991).
Measurement
Because of the strong dependence of biological effects on wavelength, the principal measurement of any UVR source is its spectral power or spectral irradiance distribution. This must be measured with a spectroradiometer which consists of suitable input optics, a monochromator and a UVR detector and readout. Such an instrument is not normally used in occupational hygiene.
In many practical situations, a broad-band UVR meter is used to determine safe exposure durations. For safety purposes, the spectral response can be tailored to follow the spectral function used for the exposure guidelines of the ACGIH and the IRPA. If appropriate instruments are not used, serious errors of hazard assessment will result. Personal UVR dosimeters are also available (e.g., polysulphone film), but their application has been largely confined to occupational safety research rather than in hazard evaluation surveys.
Conclusions
Molecular damage of key cellular components arising from UVR exposure occurs constantly, and repair mechanisms exist to deal with the exposure of skin and ocular tissues to ultraviolet radiation. Only when these repair mechanisms are overwhelmed does acute biological injury become apparent (Smith 1988). For these reasons, minimizing occupational UVR exposure continues to remain an important object of concern among occupational health and safety workers.
" DISCLAIMER: The ILO does not take responsibility for content presented on this web portal that is presented in any language other than English, which is the language used for the initial production and peer-review of original content. Certain statistics have not been updated since the production of the 4th edition of the Encyclopaedia (1998)."