Tuesday, 22 March 2011 20:34

Cold Indices and Standards

Rate this item
(1 Vote)

Cold stress is defined as a thermal load on the body under which greater than normal heat losses are anticipated and compensatory thermoregulatory actions are required to maintain the body thermally neutral. Normal heat losses, hence, refer to what people normally experience during indoor living conditions (air temperature 20 to 25ºC).

In contrast to conditions in the heat, clothing and activity are positive factors in the sense that more clothing reduces heat loss and more activity means higher internal heat production and a greater potential for balancing heat loss. Accordingly, assessment methods focus on the determination of required protection (clothing) at given activity levels, required activity levels for given protection or “temperature” values for given combinations of the two (Burton and Edholm 1955; Holmér 1988; Parsons 1993).

It is important to recognize, however, that there are limits as to how much clothing can be worn and how high a level of activity can be sustained for extended time periods. Cold-protective clothing tends to be bulky and hobbling. More space is required for motion and movements. Activity level may be determined by paced work but should, preferably, be controlled by the individual. For each individual there is a certain highest energy production rate, depending on physical work capacity, that can be sustained for prolonged time periods. Thus, high physical work capacity may be advantageous for prolonged, extreme exposures.

This article deals with methods for assessment and control of cold stress. Problems related to organizational, psychological, medical and ergonomic aspects are dealt with elsewhere.

Cold Work

Cold work encompasses a variety of conditions under natural as well as artificial conditions. The most extreme cold exposure is associated with missions in outer space. However, cold working conditions on the surface of the earth cover a temperature range of more than 100ºC (table 1). Naturally, the magnitude and severity of cold stress will be expected to increase with lowered ambient temperature.

Table 1. Air temperatures of various cold occupational environments

–120 ºC

Climatic chamber for human cryotherapy

–90 ºC

Lowest temperature at south polar base Vostock

–55 ºC

Cold store for fish meat and production of frozen, dried products

–40 ºC

“Normal” temperature at polar base

–28 ºC

Cold store for deep-frozen products

+2 to +12 ºC

Storage, preparation and transportation of fresh, alimentary products

–50 to –20 ºC

Average January temperature of northern Canada and Siberia

–20 to –10 ºC

Average January temperature of southern Canada, northern Scandinavia, central Russia

–10 to 0 ºC

Average January temperature of northern USA, southern Scandinavia, central Europe, parts of middle and far East, central and northern Japan

Source: Modified from Holmér 1993.

It is clear from 1 table  that large populations of outdoor workers in many countries experience more or less severe cold stress. In addition cold store work occurs in all parts of the world. Surveys in Scandinavian countries reveal that approximately 10% of the total worker population regard cold as a major annoyance factor in the workplace.

Types of Cold Stress

The following types of cold stress can be defined:

    • whole-body cooling
    • local cooling, including extremity cooling, convective skin cooling (wind chill), conductive skin cooling (contact cooling) and cooling of respiratory tract.


      Most likely, several if not all of these may be present at the same time.

      The assessment of cold stress involves the ascertainment of a risk of one or more of the mentioned effects. Typically, table 2 may be used as a first rough classification. In general cold stress increases, the lower the level of physical activity and the less protection available.

      Table 2. Schematic classification of cold work

      Temperature

      Type of work

      Type of cold stress

      10 to 20 ºC

      Sedentary, light work, fine manual work

      Whole-body cooling, extremity cooling

      0 to 10 ºC

      Sedentary and stationary, light work

      Whole-body cooling, extremity cooling

      –10 to 0 ºC

      Light physical work, handling tools and materials

      Whole-body cooling, extremity cooling, contact cooling

      –20 to –10 ºC

      Moderate activity, handling metals and fluids (petrol etc.), windy conditions

      Whole-body cooling, extremity cooling, contact cooling, convective cooling

      Below –20 ºC

      All types of work

      All types of cold stress


      Information given in the table should be interpreted as a signal to action. In other words, the particular type of cold stress should be evaluated and controlled, if required. At moderate temperatures problems associated with discomfort and losses of function due to local cooling prevail. At lower temperatures the imminent risk of a cold injury as a sequel to the other effects is the important factor. For many of the effects discrete relationships between stress level and effect do not yet exist. It cannot be excluded that a particular cold problem may persist also outside the range of temperatures denoted by the table.

      Assessment Methods

      Methods for assessment of cold stress are presented in ISO Technical Report 11079 (ISO TR 11079, 1993). Other standards concerning determination of metabolic heat production (ISO 8996, 1988), estimation of clothing thermal characteristics (ISO 9920, 1993), and physiological measurements (ISO DIS 9886, 1989c) provide complementary information useful for the evaluation of cold stress.

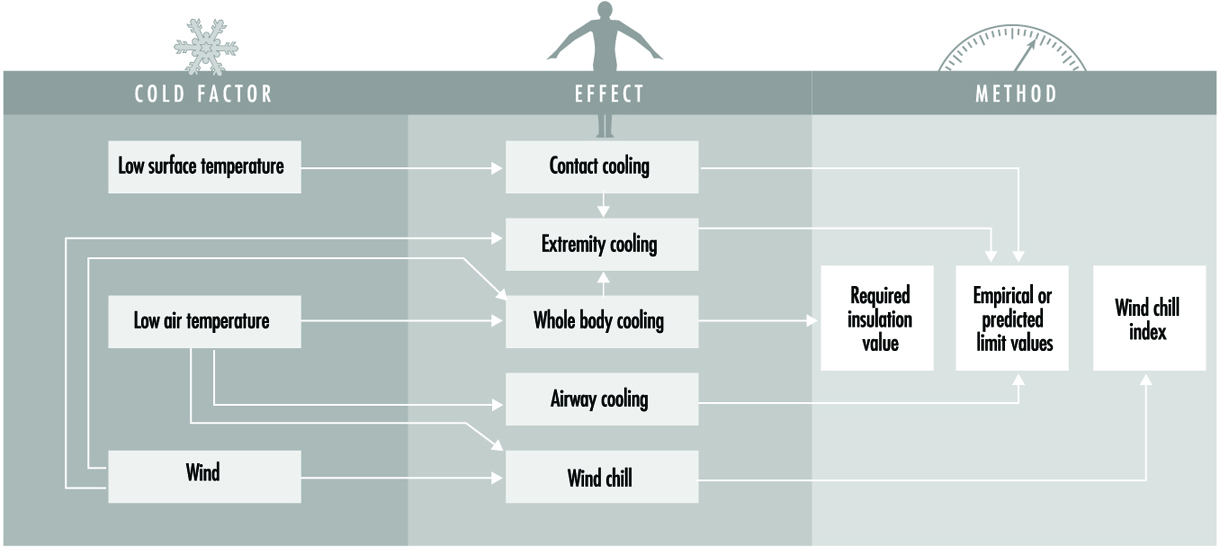
      Figure 1 outlines the relationships between climate factors, anticipated cooling effect and recommended method for assessment. Further details about methods and data collection are given below.

      Figure 1. Assessment of cold stress in relation to climatic factors and cooling effects.

      HEA110F1

      Whole-Body Cooling

      The risk of whole-body cooling is determined by analysing the conditions for body heat balance. The clothing insulation level required for heat balance at defined levels of physiological strain, is calculated with a mathematical heat balance equation. The calculated required insulation value, IREQ, can be regarded as a cold stress index. The value indicates a protection level (expressed in clo). The higher the value, the greater the risk of body heat imbalance. The two levels of strain correspond to a low level (neutral or “comfort” sensation) and a high level (slightly cold to cold sensation).

      Using IREQ comprises three evaluation steps:

        • determination of IREQ for given exposure conditions
        • comparison of IREQ with protection level provided by clothing
        • determination of exposure time if protection level is of lesser value than IREQ


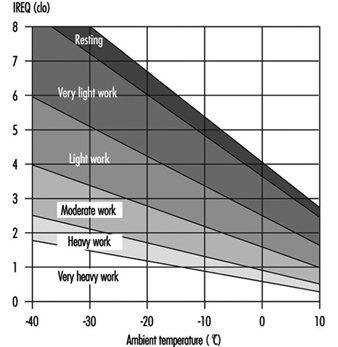
            Figure 2 shows IREQ values for low physiological strain (neutral thermal sensation). Values are given for different activity levels.

            Figure 2. IREQ values needed to maintain low-level physiological strain (neutral thermal sensation) at varying temperature.

            HEA110F2

            Methods to estimate activity levels are described in ISO 7243 (table 3).

            Table 3. Classification of levels of metabolic rate

            Class

            Metabolic rate range, M

            Value to be used for calculation of mean metabolic rate

            Examples


            Related to
            a unit skin surface area (W/m2)

            For a mean skin surface area
            of 1.8 m2
            (W)


            (W/m2)


            (W)


            0
            Resting

            M≤65

            M≥117

            65

            117

            Resting

            1
            Low
            metabolic rate

            65M≤130

            117M≤234

            100

            180

            Sitting at ease: light manual work (writing, typing, drawing, sewing, book-keeping); hand and arm work (small bench tools, inspection, assembly or sorting of light material); arm and leg work (driving vehicle in normal conditions, operating foot switch or pedals).

            Standing: drill (small parts); milling machine (small parts); coil winding; small armature winding; machining with low power tools; casual walking (speed up to 3.5 km/h).

            2
            Moderate
            metabolic rate

            130M≤200

            234M≤360

            165

            297

            Sustained hand and arm work (hammering in nails, filling); arm and leg work (off-road operation of lorries, tractors or construction equipment); arm and trunk work (work with pneumatic hammer, tractor assembly, plastering, intermittent handling of moderately heavy material, weeding, hoeing, picking fruit or vegetables); pushing or pulling light weight carts or wheelbarrows; walking at a speed of 3.5 km/h; forging.

            3
            High
            metabolic rate

            200M≤260

            360M≤468

            230

            414

            Intense arm and trunk work: carrying heavy material; shoveling; sledge hammer work; sawing, planning or chiselling hard wood; hand mowing; digging; walking at a speed of 5.5 km/h to 7 km/h.

            Pushing or pulling heavily loaded handcarts or wheelbarrows; chipping castings; concrete block laying.

            4
            Very high
            metabolic rate

            M>260

            M>468

            290

            522

            Very intensive activity at fast to maximum pace; working with an axe; intense shovelling or digging; climbing stairs, ramp or ladder; walking quickly with small steps, running, walking at a speed greater than 7 km/h.

            Source: ISO 7243 1989a

            Once IREQ is determined for given conditions, the value is compared with the protection level offered by clothing. Protection level of a clothing ensemble is determined by its resultant insulation value (“clo-value”). This property is measured according to the draft European standard prEN-342 (1992). It can also be derived from basic insulation values provided in tables (ISO 9920).

            Table 4. provides examples of basic insulation values for typical ensembles. Values must be corrected for presumed reduction caused by body motion and ventilation. Typically, no correction is made for resting level. Values are reduced by 10% for light work and by 20% for higher activity levels.

            Table 4. Examples of basic insulation values (Icl) of clothing*

            Clothing ensemble

            Icl (m2 ºC/W)

            Icl (clo)

            Briefs, short-sleeve shirt, fitted trousers, calf-length socks, shoes

            0.08

            0.5

            Underpants, shirt, fitted, trousers, socks, shoes

            0.10

            0.6

            Underpants, coverall, socks, shoes

            0.11

            0.7

            Underpants, shirt, coverall, socks, shoes

            0.13

            0.8

            Underpants, shirt, trousers, smock, socks, shoes

            0.14

            0.9

            Briefs, undershirt, underpants, shirt, overalls, calf-length socks, shoes

            0.16

            1.0

            Underpants, undershirt, shirt, trousers, jacket, vest, socks, shoes

            0.17

            1.1

            Underpants, shirt, trousers, jacket, coverall, socks, shoes

            0.19

            1.3

            Undershirt, underpants, insulated trousers, insulated jacket, socks, shoes

            0.22

            1.4

            Briefs, T-shirt, shirt, fitted trousers, insulated coveralls, calf-length socks, shoes

            0.23

            1.5

            Underpants, undershirt, shirt, trousers, jacket, overjacket, hat, gloves, socks, shoes

            0.25

            1.6

            Underpants, undershirt, shirt, trousers, jacket, overjacket, overtrousers, socks, shoes

            0.29

            1.9

            Underpants, undershirt, shirt, trousers, jacket, overjacket, overtrousers, socks, shoes, hat, gloves

            0.31

            2.0

            Undershirt, underpants, insulated trousers, insulated jacket, overtrousers, overjacket, socks, shoes

            0.34

            2.2

            Undershirt, underpants, insulated trousers, insulated jacket, overtrousers, socks, shoes, hat, gloves

            0.40

            2.6

            Undershirt, underpants, insulated trousers, insulated jacket, overtrousers and parka with lining, socks, shoes, hat, mittens

            0.40–0.52

            2.6–3.4

            Arctic clothing systems

            0.46–0.70

            3–4.5

            Sleeping bags

            0.46–1.1

            3–8

            *Nominal protection level applies only to static, windstill conditions (resting). Values must be reduced with increased activity level.

            Source: Modified from ISO/TR-11079 1993.

            The protection level offered by the best available clothing systems corresponds to 3 to 4 clo. When the available clothing system does not provide sufficient insulation, a time limit is calculated for the actual conditions. This time limit depends on the difference between required clothing insulation and that of the available clothing. Since, full protection against cooling is no longer achieved, the time limit is calculated on the basis of an anticipated reduction of body heat content. Similarly, a recovery time can be calculated to restore the same amount of heat.

            Figure 3 shows examples of time limits for light and moderate work with two insulation levels of clothing. Time limits for other combinations may be estimated by interpolation. Figure 4 can be used as a guideline for assessment of exposure time, when the best cold protective clothing is available.

            Figure 3. Time limits for light and moderate work with two insulation levels of clothing.

            HEA110F3

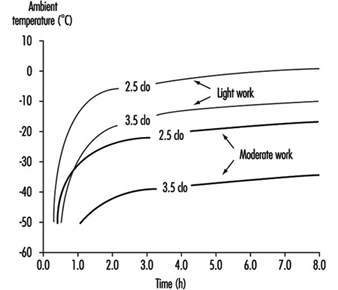
            Figure 4. Time-weighted IREQ values for intermittent and continuous exposure to cold.

            HEA110F4

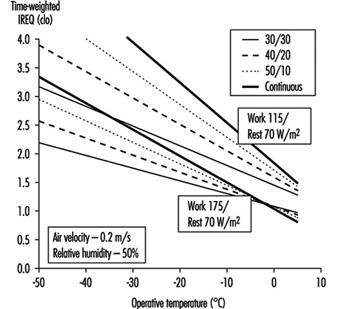
            Intermittent exposures typically comprise work periods interrupted by warm-up breaks or by work periods in a warmer environment. In most conditions, little or no replacement of clothing takes place (mostly for practical reasons). IREQ may then be determined for the combined exposure as a time-weighted average. Averaging period must not be longer than one to two hours. Time-weighted IREQ values for some types of intermittent exposure are given in figure 4.

            IREQ values and time limits should be indicative rather than normative. They refer to the average person. The individual variation in terms of characteristics, requirements and preferences is large. Much of this variation must be handled by selecting clothing ensembles with great flexibility in terms of, for example, adjustment of the protection level.


            Extremity Cooling

            The extremities—in particular, fingers and toes—are susceptible to cooling. Unless sufficient heat input by warm blood can be maintained, tissue temperature progressively falls. Extremity blood flow is determined by energetic (required for muscles activity) as well as thermoregulatory needs. When whole-body thermal balance is challenged, peripheral vasoconstriction helps to reduce core heat losses at the expense of peripheral tissues. With high activity more heat is available and extremity blood flow can more easily be maintained.

            The protection offered by handwear and footwear in terms of reducing heat losses is limited. When heat input to the extremity is low (e.g., with resting or low activity), the insulation required to keep hands and feet warm is very large (van Dilla, Day and Siple 1949). The protection offered by gloves and mittens only provides retardation of cooling rate and, correspondingly, longer times to reach a critical temperature. With higher activity levels, improved protection allows warm hands and feet at lower ambient temperatures.

            No standard method is available for assessment of extremity cooling. However, ISO TR 11079 recommends 24ºC and 15ºC as critical hand temperatures for levels of low and high stress, respectively. Fingertip temperature may easily be 5 to 10 °C lower than the average hand skin temperature or simply the temperature of the back of the hand.

            The information given in figure 5 is useful when determining acceptable exposure times and required protection. The two curves refer to conditions with and without vasoconstriction (high and low activity level). Furthermore, it is assumed that finger insulation is high (two clo) and adequate clothing is used.

            Figure 5. Finger protection.

            HEA110F5

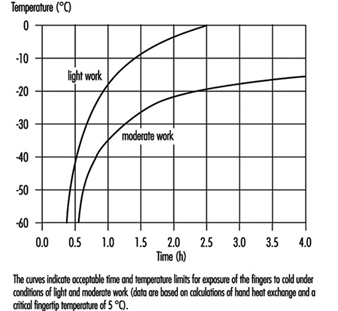
            A similar set of curves should apply to toes. However, more clo may be available for protection of feet, resulting in longer exposure times. Nevertheless, it follows from figures 3 and 5 that extremity cooling most likely is more critical for exposure time than whole-body-cooling.


            Protection provided by handwear is evaluated by using methods described in the European standard EN-511 (1993). Thermal insulation of the whole handwear is measured with an electrically heated hand model. A wind speed of 4 m/s is used to simulate realistic wear conditions. Performance is given in four classes (table 5).

            Table 5. Classification of thermal resistance (I) to convective cooling of handwear

            Class

            I (m2 ºC/W)

            1

            0.10 ≤ I 0.15

            2

            0.15 ≤ I 0.22

            3

            0.22 ≤ I 0.30

            4

            I ≤ 0.30

            Source: Based on EN 511 (1993).

            Contact Cold

            Contact between bare hand and cold surfaces may quickly reduce skin temperature and cause freezing injury. Problems may arise with surface temperatures as high as 15ºC. In particular, metal surfaces provide excellent conductive properties and may quickly cool contacting skin areas.

            At present no standard method exists for general assessment of contact cooling. The following recommendations can be given (ACGIH 1990; Chen, Nilsson and Holmér 1994; Enander 1987):

              • Prolonged contact with metal surfaces below 15ºC may impair dexterity.
              • Prolonged contact with metal surfaces below 7ºC may induce numbness.
              • Prolonged contact with metal surfaces below 0ºC may induce frostnip or frostbite.
              • Brief contact with metal surfaces below –7ºC may induce frostnip or frostbite.
              • Any contact with liquids at subzero temperature must be avoided.


                      Other materials present a similar sequence of hazards, but temperatures are lower with less conducting material (plastics, wood, foam).

                      Protection against contact cooling provided by handwear can be determined using the European standard EN 511. Four performance classes are given (table 6).

                      Table 6. Classification of contact thermal resistance of handwear (I)

                      Class

                      I (m2 ºC/W)

                      1

                      0.025 ≤ I 0.05

                      2

                      0.05 ≤ I 0.10

                      3

                      0.10 ≤ I 0.15

                      4

                      I ≤ 0.15

                      Source: Based on EN 511 (1993).

                      Convective Skin Cooling

                      The Wind Chill Index (WCI) represents a simple, empirical method for assessment of cooling of unprotected skin (face) (ISO TR 11079). The method predicts tissue heat loss on the basis of air temperature and wind speed.

                      Responses associated with different values of WCI are denoted in table 7.

                      Table 7. Wind Chill Index (WCI), equivalent cooling temperature (Teq ) and freezing time of exposed flesh

                      WCI (W/m2)

                      Teq (ºC)

                      Effect

                      1,200

                      –14

                      Very cold

                      1,400

                      –22

                      Bitterly cold

                      1,600

                      –30

                      Exposed flesh freezes

                      1,800

                      –38

                      within 1 hour

                      2,000

                      –45

                      Exposed flesh freezes

                      2,200

                      –53

                      within 1 minute

                      2,400

                      –61

                      Exposed flesh freezes

                      2,600

                      –69

                      within 30 seconds


                      A frequently used interpretation of WCI is the equivalent cooling temperature. This temperature under calm conditions (1.8 m/s) represents the same WCI value as the actual combination of temperature and wind. Table 8 provides equivalent cooling temperatures for combinations of air temperature and wind speed. The table applies to active, well-dressed persons. A risk is present when equivalent temperature drops below –30ºC, and skin may freeze within 1 to 2 min below –60ºC.

                      Table 8. Cooling power of wind on exposed flesh expressed as an equivalent cooling temperature under almost calm conditions (wind speed 1.8 m/s)

                      Wind speed (m/s)

                      Actual thermometer reading (ºC)


                      0

                      –5

                      –10

                      –15

                      –20

                      –25

                      –30

                      –35

                      –40

                      –45

                      –50


                      Equivalent cooling temperature (ºC)

                      1.8

                      0

                      –5

                      –10

                      –15

                      –20

                      –25

                      –30

                      –35

                      –40

                      –45

                      –50

                      2

                      –1

                      –6

                      –11

                      –16

                      –21

                      –27

                      –32

                      –37

                      –42

                      –47

                      –52

                      3

                      –4

                      –10

                      –15

                      –21

                      –27

                      –32

                      –38

                      –44

                      –49

                      –55

                      –60

                      5

                      –9

                      –15

                      –21

                      –28

                      –34

                      –40

                      –47

                      –53

                      –59

                      –66

                      –72

                      8

                      –13

                      –20

                      –27

                      –34

                      –41

                      –48

                      –55

                      –62

                      –69

                      –76

                      –83

                      11

                      –16

                      –23

                      –31

                      –38

                      –46

                      –53

                      –60

                      –68

                      –75

                      –83

                      –90

                      15

                      –18

                      –26

                      –34

                      –42

                      –49

                      –57

                      –65

                      –73

                      –80

                      –88

                      –96

                      20

                      –20

                      –28

                      –36

                      –44

                      –52

                      –60

                      –68

                      –76

                      –84

                      –92

                      –100

                      Underlined values represent a risk for frostnip or frostbite.

                      Cooling of Respiratory Tract

                      Inhaling cold, dry air may cause problems for sensitive persons at +10 to 15ºC. Healthy persons performing light to moderate work require no particular protection of the respiratory tract down to –30ºC. Very heavy work during prolonged exposures (e.g., athletic endurance events) should not take place at temperatures below –20ºC.

                      Similar recommendations apply to cooling of the eye. In practice, the great discomfort and visual impairment associated with eye cooling normally require the use of goggles or other protection long before the exposure becomes hazardous.
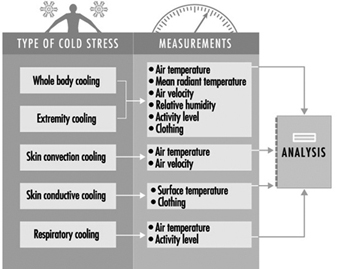
                      Measurements

                      Depending on type of expected risk, different sets of measurements are required (figure 6). Procedures for data collection and accuracy of measurements depend on the purpose of the measurements. Pertinent information must be obtained regarding variation in time of the climatic parameters, as well as of activity level and/or clothing. Simple time-weighting procedures should be adopted (ISO 7726).

                      Figure 6. The relationship of expected cold stress risk to required measurement procedures.

                      HEA110F6

                      Preventive Measures for Alleviation of Cold Stress

                      Actions and measures for the control and reduction of cold stress imply a number of considerations during the planning and preparatory phases of work shifts, as well as during work, which are dealt with elsewhere in this chapter and this Encyclopaedia.


                      Back

                      Read 12031 times Last modified on Tuesday, 26 July 2022 21:25

                      " DISCLAIMER: The ILO does not take responsibility for content presented on this web portal that is presented in any language other than English, which is the language used for the initial production and peer-review of original content. Certain statistics have not been updated since the production of the 4th edition of the Encyclopaedia (1998)."

                      Contents

                      Heat and Cold References

                      ACGIH (American Conference of Governmental Industrial Hygienists). 1990. Threshold Limit Values and Biological Exposure Indices for 1989–1990. New York: ACGIH.

                      —. 1992. Cold stress. In Threshold Limit Values for Physical Agents in the Work Environment. New York: ACGIH.

                      Bedford, T. 1940. Environmental warmth and its measurement. Medical Research Memorandum No. 17. London: Her Majesty’s Stationery Office.

                      Belding, HS and TF Hatch. 1955. Index for evaluating heat stress in terms of resulting physiological strain. Heating Piping Air Condit 27:129–136.

                      Bittel, JHM. 1987. Heat debt as an index for cold adaptation in men. J Appl Physiol 62(4):1627–1634.

                      Bittel, JHM, C Nonotte-Varly, GH Livecchi-Gonnot, GLM Savourey and AM Hanniquet. 1988. Physical fitness and thermoregulatory reactions in a cold environment in men. J Appl Physiol 65:1984-1989.

                      Bittel, JHM, GH Livecchi-Gonnot, AM Hanniquet and JL Etienne. 1989. Thermal changes observed before and after J.L. Etienne’s journey to the North Pole. Eur J Appl Physiol 58:646–651.

                      Bligh, J and KG Johnson. 1973. Glossary of terms for thermal physiology. J Appl Physiol 35(6):941–961.

                      Botsford, JH. 1971. A wet globe thermometer for environmental heat measurement. Am Ind Hyg J 32:1–10.

                      Boutelier, C. 1979. Survie et protection des équipages en cas d’immersion accidentelle en eau froide. Neuilly-sur-Seine: AGARD A.G. 211.

                      Brouha, L. 1960. Physiology in Industry. New York: Pergamon Press.

                      Burton, AC and OG Edholm. 1955. Man in a Cold Environment. London: Edward Arnold.

                      Chen, F, H Nilsson and RI Holmér. 1994. Cooling responses of finger pad in contact with an aluminum surface. Am Ind Hyg Assoc J 55(3):218-22.

                      Comité Européen de Normalisation (CEN). 1992. EN 344. Protective Clothing Against Cold. Brussels: CEN.

                      —. 1993. EN 511. Protective Gloves Against Cold. Brussels: CEN.

                      Commission of the European Communities (CEC). 1988. Proceedings of a seminar on heat stress indices. Luxembourg: CEC, Health and Safety Directorate.

                      Daanen, HAM. 1993. Deterioration of manual performance in cold and windy conditions. AGARD, NATO, CP-540.

                      Dasler, AR. 1974. Ventilation and thermal stress, ashore and afloat. In Chapter 3, Manual of Naval Preventive Medicine. Washington, DC: Navy Department, Bureau of Medicine and Surgery.

                      —. 1977. Heat stress, work functions and physiological heat exposure limits in man. In Thermal Analysis—Human Comfort—Indoor Environments. NBS Special Publication 491. Washington, DC: US Department of Commerce.

                      Deutsches Institut für Normierung (DIN) 7943-2. 1992. Schlafsacke, Thermophysiologische Prufung. Berlin: DIN.

                      Dubois, D and EF Dubois. 1916. Clinical calorimetry X: A formula to estimate the appropiate surface area if height and weight be known. Arch Int Med 17:863–871.

                      Eagan, CJ. 1963. Introduction and terminology. Fed Proc 22:930–933.

                      Edwards, JSA, DE Roberts, and SH Mutter. 1992. Relations for use in a cold environment. J Wildlife Med 3:27–47.

                      Enander, A. 1987. Sensory reactions and performance in moderate cold. Doctoral thesis. Solna: National Institute of Occupational Health.

                      Fuller, FH and L Brouha. 1966. New engineering methods for evaluating the job environment. ASHRAE J 8(1):39–52.

                      Fuller, FH and PE Smith. 1980. The effectiveness of preventive work procedures in a hot workshop. In FN Dukes-Dobos and A Henschel (eds.). Proceedings of a NIOSH Workshop on Recommended Heat Stress Standards. Washington DC: DHSS (NIOSH) publication No. 81-108.

                      —. 1981. Evaluation of heat stress in a hot workshop by physiological measurements. Am Ind Hyg Assoc J 42:32–37.

                      Gagge, AP, AP Fobelets and LG Berglund. 1986. A standard predictive index of human response to the thermal environment. ASHRAE Trans 92:709–731.

                      Gisolfi, CV and CB Wenger. 1984. Temperature regulation during exercise: Old concepts, new ideas. Exercise Sport Sci Rev 12:339–372.

                      Givoni, B. 1963. A new method for evaluating industrial heat exposure and maximum permissible work load. Paper submitted to the International Biometeorological Congress in Paris, France, September 1963.

                      —. 1976. Man, Climate and Architecture, 2nd ed. London: Applied Science.

                      Givoni, B and RF Goldman. 1972. Predicting rectal temperature response to work, environment and clothing. J Appl Physiol 2(6):812–822.

                      —. 1973. Predicting heart rate response to work, environment and clothing. J Appl Physiol 34(2):201–204.

                      Goldman, RF. 1988. Standards for human exposure to heat. In Environmental Ergonomics, edited by IB Mekjavic, EW Banister and JB Morrison. London: Taylor & Francis.

                      Hales, JRS and DAB Richards. 1987. Heat Stress. Amsterdam, New York: Oxford Excerpta Medica.

                      Hammel, HT. 1963. Summary of comparative thermal patterns in man. Fed Proc 22:846–847.

                      Havenith, G, R Heus and WA Lotens. 1990. Clothing ventilation, vapour resistance and permeability index: Changes due to posture, movement and wind. Ergonomics 33:989–1005.

                      Hayes. 1988. In Environmental Ergonomics, edited by IB Mekjavic, EW Banister and JB Morrison. London: Taylor & Francis.

                      Holmér, I. 1988. Assessment of cold stress in terms of required clothing insulation—IREQ. Int J Ind Erg 3:159–166.

                      —. 1993. Work in the cold. Review of methods for assessment of cold stress. Int Arch Occ Env Health 65:147–155.

                      —. 1994. Cold stress: Part 1—Guidelines for the practitioner. Int J Ind Erg 14:1–10.

                      —. 1994. Cold stress: Part 2—The scientific basis (knowledge base) for the guide. Int J Ind Erg 14:1–9.

                      Houghton, FC and CP Yagoglou. 1923. Determining equal comfort lines. J ASHVE 29:165–176.

                      International Organization for Standardization (ISO). 1985. ISO 7726. Thermal Environments—Instruments and Methods for Measuring Physical Quantities. Geneva: ISO.

                      —. 1989a. ISO 7243. Hot Environments—Estimation of the Heat Stress on Working Man, Based on the WBGT Index (Wet Bulb Globe Temperature). Geneva: ISO.

                      —. 1989b. ISO 7933. Hot Environments—Analytical Determination and Interpretation of Thermal Stress using Calculation of Required Sweat Rate. Geneva: ISO.

                      —. 1989c. ISO DIS 9886. Ergonomics—Evaluation of Thermal Strain by Physiological Measurements. Geneva: ISO.

                      —. 1990. ISO 8996. Ergonomics—Determination of Metabolic Heat Production. Geneva: ISO.

                      —. 1992. ISO 9886. Evaluation of Thermal Strain by Physiological Measurements. Geneva: ISO.

                      —. 1993. Assessment of the Influence of the Thermal Environment using Subjective Judgement Scales. Geneva: ISO.

                      —. 1993. ISO CD 12894. Ergonomics of the Thermal Environment—Medical Supervision of Individuals Exposed to Hot or Cold Environments. Geneva: ISO.

                      —. 1993. ISO TR 11079 Evaluation of Cold Environments—Determination of Required Clothing Insulation, IREQ. Geneva: ISO. (Technical Report)

                      —. 1994. ISO 9920. Ergonomics—Estimation of the Thermal Characteristics of a Clothing Ensemble. Geneva: ISO.

                      —. 1994. ISO 7730. Moderate Thermal Environments—Determination of the PMV and PPD Indices and Specification of the Conditions for Thermal Comfort. Geneva: ISO.

                      —. 1995. ISO DIS 11933. Ergonomics of the Thermal Environment. Principles and Application of International Standards. Geneva: ISO.

                      Kenneth, W, P Sathasivam, AL Vallerand and TB Graham. 1990. Influence of caffeine on metabolic responses of men at rest in 28 and 5C. J Appl Physiol 68(5):1889–1895.

                      Kenney, WL and SR Fowler. 1988. Methylcholine-activated eccrine sweat gland density and output as a function of age. J Appl Physiol 65:1082–1086.

                      Kerslake, DMcK. 1972. The Stress of Hot Environments. Cambridge: Cambridge University Press.

                      LeBlanc, J. 1975. Man in the Cold. Springfield, IL, US: Charles C Thomas Publ.

                      Leithead, CA and AR Lind. 1964. Heat Stress and Head Disorders. London: Cassell.

                      Lind, AR. 1957. A physiological criterion for setting thermal environmental limits for everybody’s work. J Appl Physiol 18:51–56.

                      Lotens, WA. 1989. The actual insulation of multilayer clothing. Scand J Work Environ Health 15 Suppl. 1:66–75.

                      —. 1993. Heat transfer from humans wearing clothing. Thesis, Technical University. Delft, Netherlands. (ISBN 90-6743-231-8).

                      Lotens, WA and G Havenith. 1991. Calculation of clothing insulation and vapour resistance. Ergonomics 34:233–254.

                      Maclean, D and D Emslie-Smith. 1977. Accidental Hypothermia. Oxford, London, Edinburgh, Melbourne: Blackwell Scientific Publication.

                      Macpherson, RK. 1960. Physiological responses to hot environments. Medical Research Council Special Report Series No. 298. London: HMSO.

                      Martineau, L and I Jacob. 1988. Muscle glycogen utilization during shivering thermogenesis in humans. J Appl Physiol 56:2046–2050.

                      Maughan, RJ. 1991. Fluid and electrolyte loss and replacement in exercise. J Sport Sci 9:117–142.

                      McArdle, B, W Dunham, HE Halling, WSS Ladell, JW Scalt, ML Thomson and JS Weiner. 1947. The prediction of the physiological effects of warm and hot environments. Medical Research Council Rep 47/391. London: RNP.

                      McCullough, EA, BW Jones and PEJ Huck. 1985. A comprehensive database for estimating clothing insulation. ASHRAE Trans 91:29–47.

                      McCullough, EA, BW Jones and T Tamura. 1989. A database for determining the evaporative resistance of clothing. ASHRAE Trans 95:316–328.

                      McIntyre, DA. 1980. Indoor Climate. London: Applied Science Publishers Ltd.

                      Mekjavic, IB, EW Banister and JB Morrison (eds.). 1988. Environmental Ergonomics. Philadelphia: Taylor & Francis.

                      Nielsen, B. 1984. Dehydration, rehydration and thermoregulation. In E Jokl and M Hebbelinck (eds.). Medicine and Sports Science. Basel: S. Karger.

                      —. 1994. Heat stress and acclimation. Ergonomics 37(1):49–58.

                      Nielsen, R, BW Olesen and P-O Fanger. 1985. Effect of physical activity and air velocity on the thermal insulation of clothing. Ergonomics 28:1617–1632.

                      National Institute for Occupational Safety and Health (NIOSH). 1972. Occupational exposure to hot environments. HSM 72-10269. Washington, DC: US Department of Health Education and Welfare.

                      —. 1986. Occupational exposure to hot environments. NIOSH Publication No. 86-113. Washington, DC: NIOSH.

                      Nishi, Y and AP Gagge. 1977. Effective temperature scale used for hypo- and hyperbaric environments. Aviation Space and Envir Med 48:97–107.

                      Olesen, BW. 1985. Heat stress. In Bruel and Kjaer Technical Review No. 2. Denmark: Bruel and Kjaer.

                      Olesen, BW, E Sliwinska, TL Madsen and P-O Fanger. 1982. Effect of body posture and activity on the thermal insulation of clothing: Measurements by a movable thermal manikin. ASHRAE Trans 88:791–805.

                      Pandolf, KB, BS Cadarette, MN Sawka, AJ Young, RP Francesconi and RR Gonzales. 1988. J Appl Physiol 65(1):65–71.

                      Parsons, KC. 1993. Human Thermal Environments. Hampshire, UK: Taylor & Francis.

                      Reed, HL, D Brice, KMM Shakir, KD Burman, MM D’Alesandro and JT O’Brian. 1990. Decreased free fraction of thyroid hormones after prolonged Antarctic residence. J Appl Physiol 69:1467–1472.

                      Rowell, LB. 1983. Cardiovascular aspects of human thermoregulation. Circ Res 52:367–379.

                      —. 1986. Human Circulation Regulation During Physical Stress. Oxford: OUP.

                      Sato, K and F Sato. 1983. Individual variations in structure and function of human eccrine sweat gland. Am J Physiol 245:R203–R208.

                      Savourey, G, AL Vallerand and J Bittel. 1992. General and local adaptation after a ski journey in a severe arctic environment. Eur J Appl Physiol 64:99–105.

                      Savourey, G, JP Caravel, B Barnavol and J Bittel. 1994. Thyroid hormone changes in a cold air environment after local cold acclimation. J Appl Physiol 76(5):1963–1967.

                      Savourey, G, B Barnavol, JP Caravel, C Feuerstein and J Bittel. 1996. Hypothermic general cold adaptation induced by local cold acclimation. Eur J Appl Physiol 73:237–244.

                      Vallerand, AL, I Jacob and MF Kavanagh. 1989. Mechanism of enhanced cold tolerance by an ephedrine/caffeine mixture in humans. J Appl Physiol 67:438–444.

                      van Dilla, MA, R Day and PA Siple. 1949. Special problems of the hands. In Physiology of Heat Regulation, edited by R Newburgh. Philadelphia: Saunders.

                      Vellar, OD. 1969. Nutrient Losses through Sweating. Oslo: Universitetsforlaget.

                      Vogt, JJ, V Candas, JP Libert and F Daull. 1981. Required sweat rate as an index of thermal strain in industry. In Bioengineering, Thermal Physiology and Comfort, edited by K Cena and JA Clark. Amsterdam: Elsevier. 99–110.

                      Wang, LCH, SFP Man and AN Bel Castro. 1987. Metabolic and hormonal responses in theophylline-increased cold resistance in males. J Appl Physiol 63:589–596.

                      World Health Organization (WHO). 1969. Health factors involved in working under conditions of heat stress. Technical Report 412. Geneva: WHO.

                      Wissler, EH. 1988. A review of human thermal models. In Environmental Ergonomics, edited by IB Mekjavic, EW Banister and JB Morrison. London: Taylor & Francis.

                      Woodcock, AH. 1962. Moisture transfer in textile systems. Part I. Textile Res J 32:628–633.

                      Yaglou, CP and D Minard. 1957. Control of heat casualties at military training centers. Am Med Assoc Arch Ind Health 16:302–316 and 405.